


In this blog, we will deep dive into one of the important services offered by Amazon Web Services (AWS) – CloudWatch. As businesses increasingly migrate to the cloud, effective monitoring and management become crucial. AWS CloudWatch emerges as a smooth solution, providing a set of tools to monitor, manage, and optimize our AWS resources.
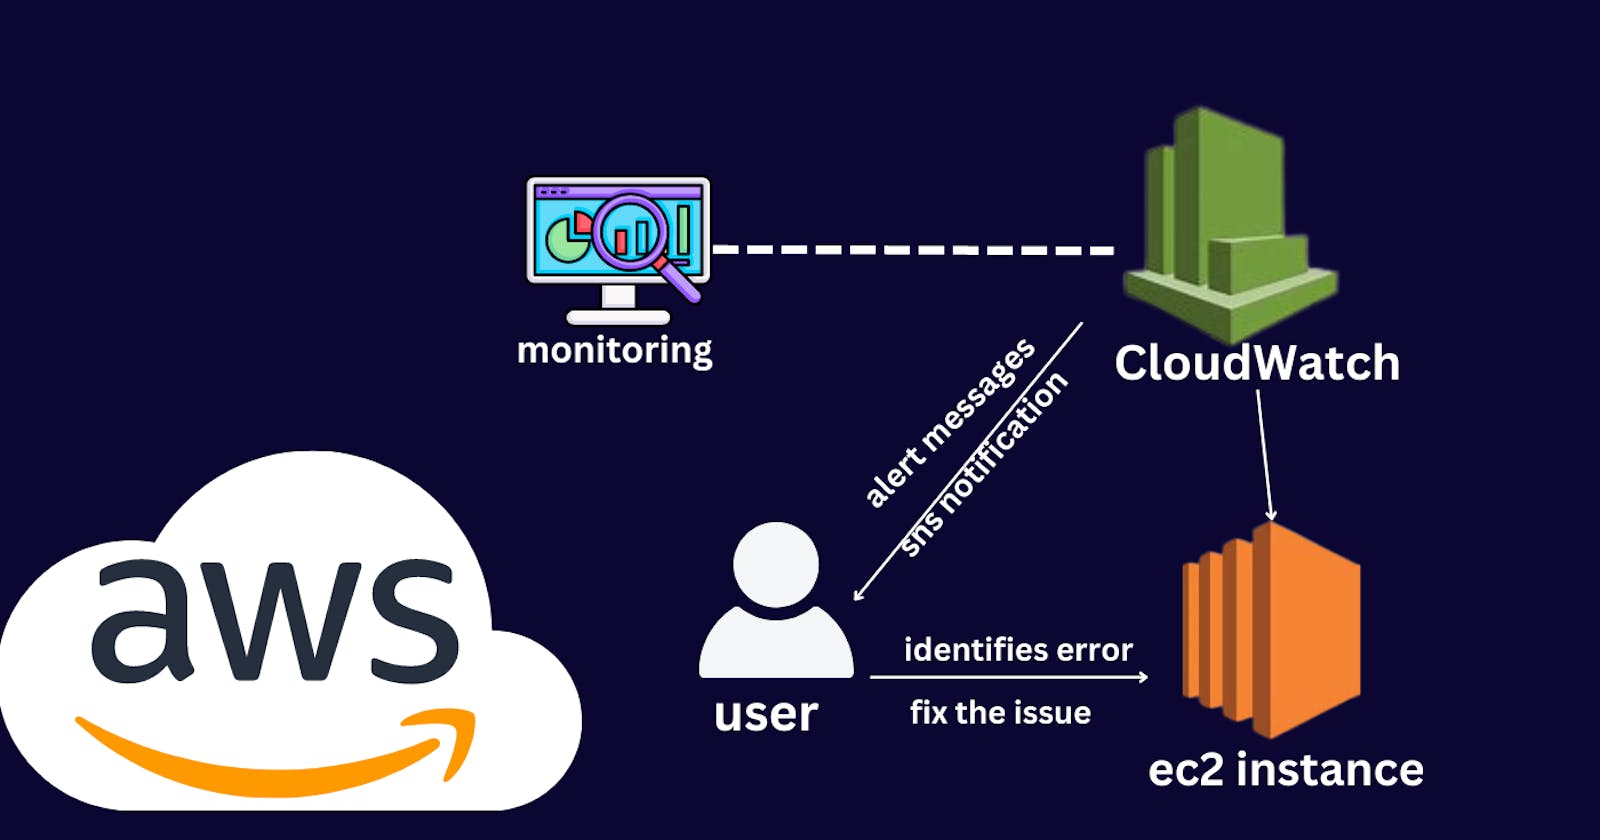
AWS CloudWatch is a centralized monitoring service that allows users to gain insights into the performance and operational health of our AWS resources. It collects and tracks metrics, monitors log files, and sets alarms to notify users of potential issues.
Essentially, CloudWatch acts as the gatekeeper for AWS which will help us in monitoring, alerting, reporting, and logging.
Why do we need Cloudwatch?
Cloudwatch solves several critical challenges:
Proactive Monitoring
Resource optimization
Automated Response
Log Management
Advantages of AWS CloudWatch:
Comprehensive Monitoring: CloudWatch allows you to monitor various AWS resources such as EC2 instances, RDS databases, Lambda functions, and more.Real-Time Metrics: It provides real-time monitoring of metrics, allowing you to respond quickly to any issues or anomalies that might arise.
Automated Actions: With CloudWatch Alarms, we can set up automated actions like triggering an Auto Scaling group to scale in or out based on certain conditions.
Log Insights: CloudWatch Insights lets us to analyze and search log data from various AWS services, making it easier to troubleshoot problems and identify trends.
Dashboards and Visualization: Create custom dashboards to visualize your application and infrastructure metrics in one place, making it easier to understand the overall health of your system.
Real Usage of AWS CloudWatch:
1. Auto Scaling: CloudWatch plays a pivotal role in Auto Scaling by monitoring metrics such as CPU utilization. When a threshold is breached, Auto Scaling can dynamically adjust the number of instances to maintain optimal performance.
2. Application Monitoring: CloudWatch is extensively used for monitoring the performance of applications deployed on AWS. Metrics such as latency, error rates, and request counts help in identifying and resolving issues promptly.
3. Cost Management: By closely monitoring resource utilization metrics, CloudWatch assists in optimizing costs by identifying underutilized or overprovisioned resources.
4. Log Analysis: CloudWatch Logs are widely employed for centralized log management. Developers and administrators can easily search, analyze, and visualize logs to troubleshoot issues efficiently.
Let's get the knowledge of Cloudwatch practically.
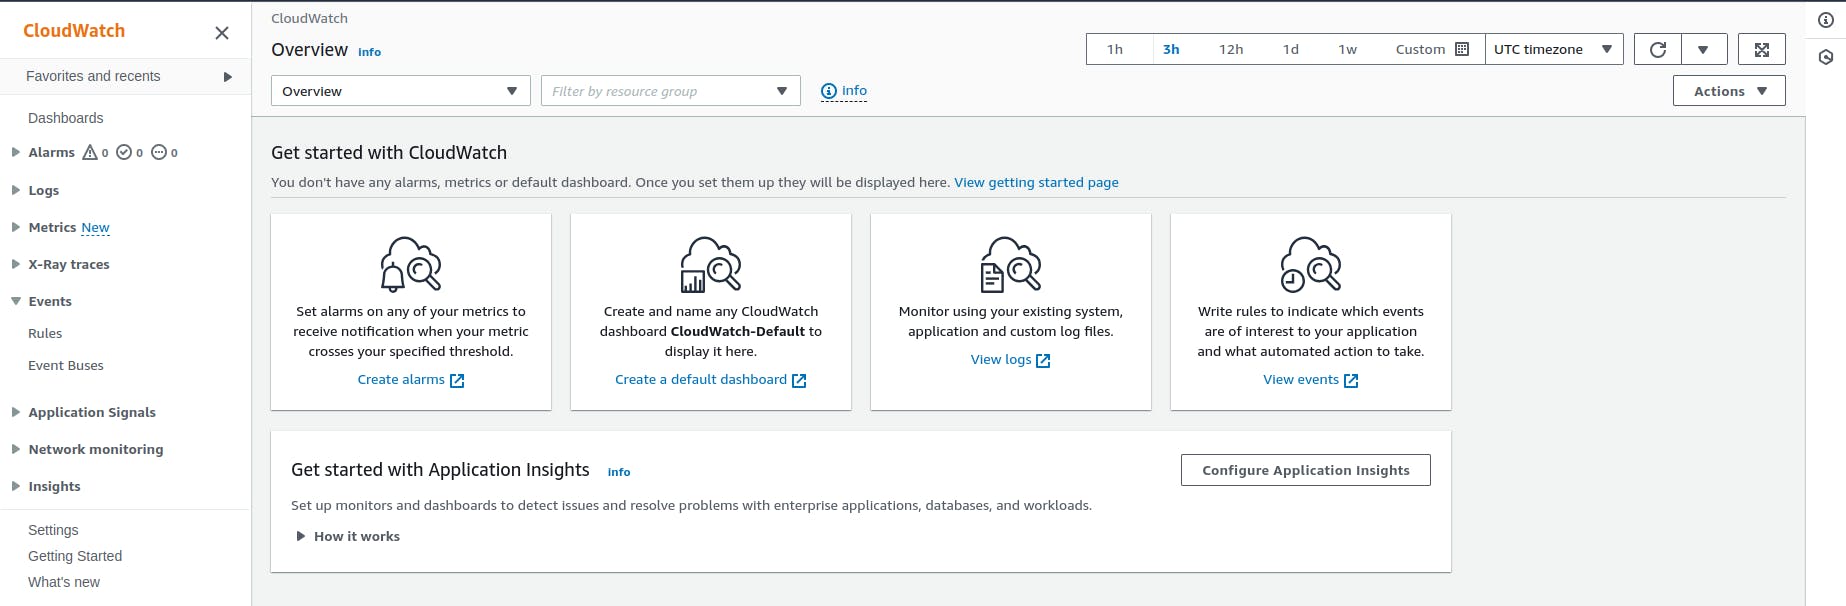
Log into your AWS account and search cloudwatch.

Once we click the cloudwatch we will see the following interface.
If we click on Logs and then to log group, it will display all the logs of our activities without any configuration.
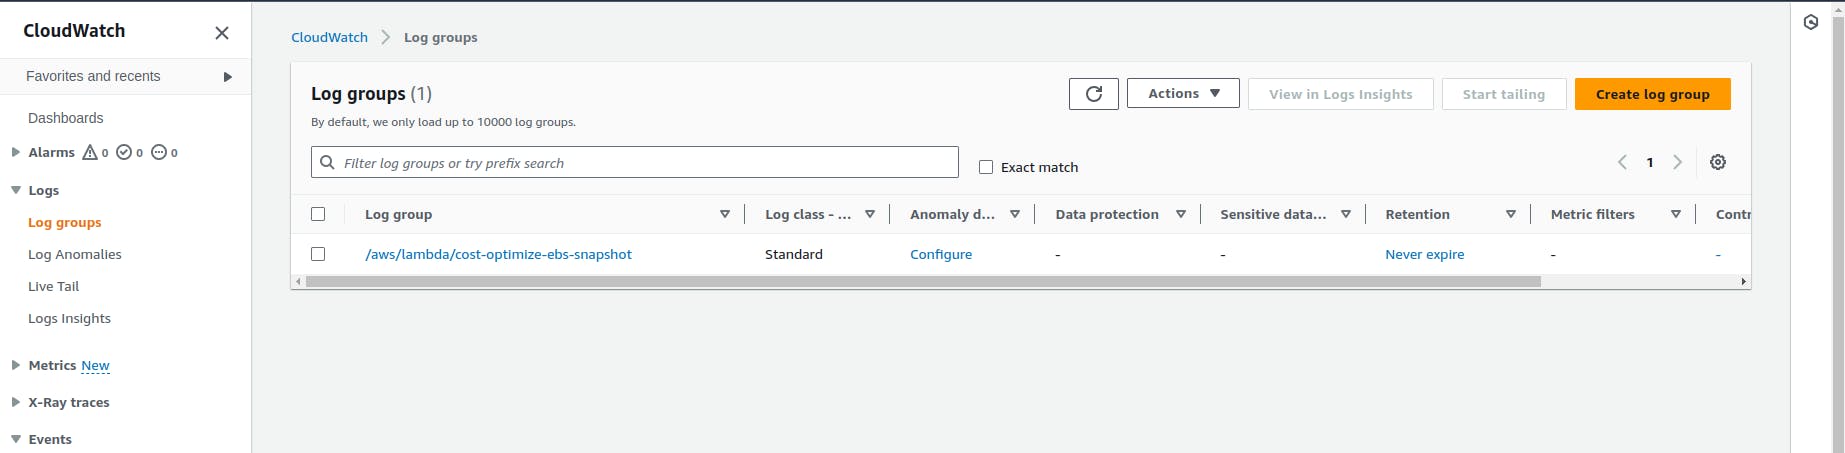
We can access these logs anytime whenever we need it. It also gives log insights if the query is passed to it.
Another feature is metrics. It provides information about disk utility, CPU information,ec2 instances, and many more.
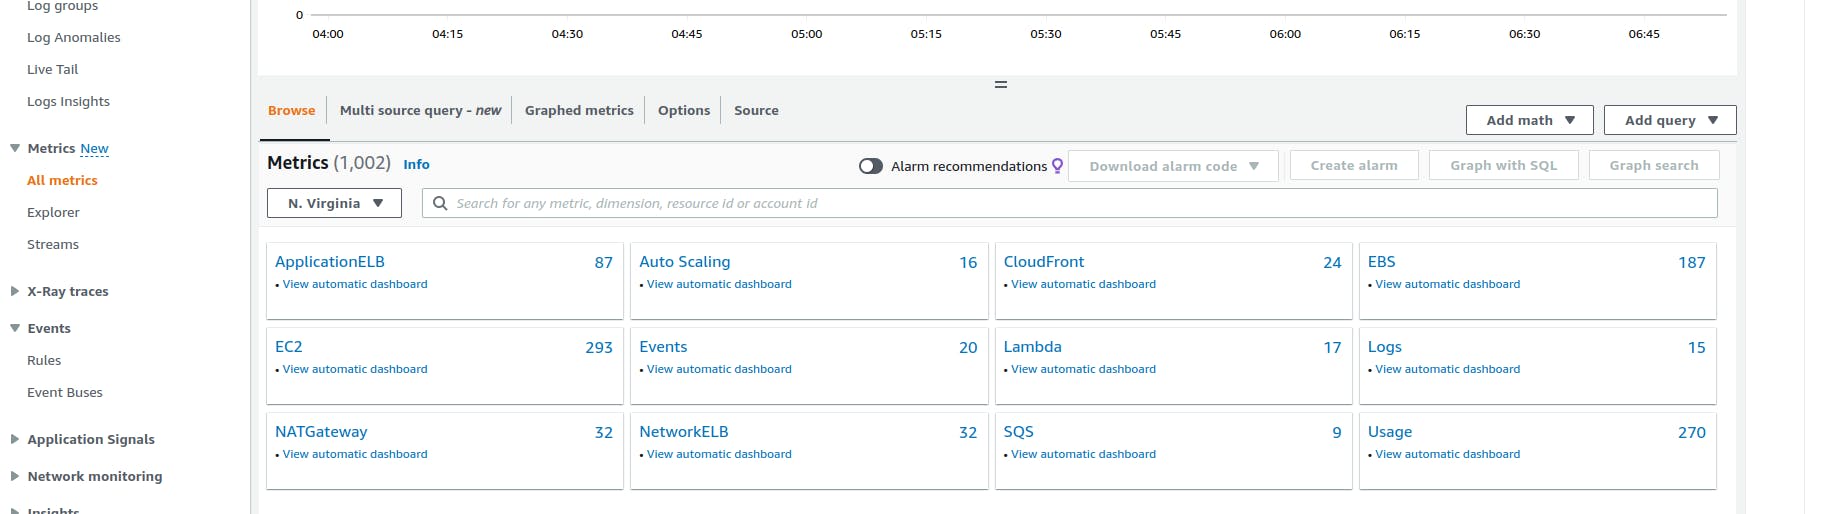
We can see that the cloudwatch is monitoring 1002 default metrics. If we click on each service, we can know at which parameter it is monitoring the services.
Create an ec2 instance.
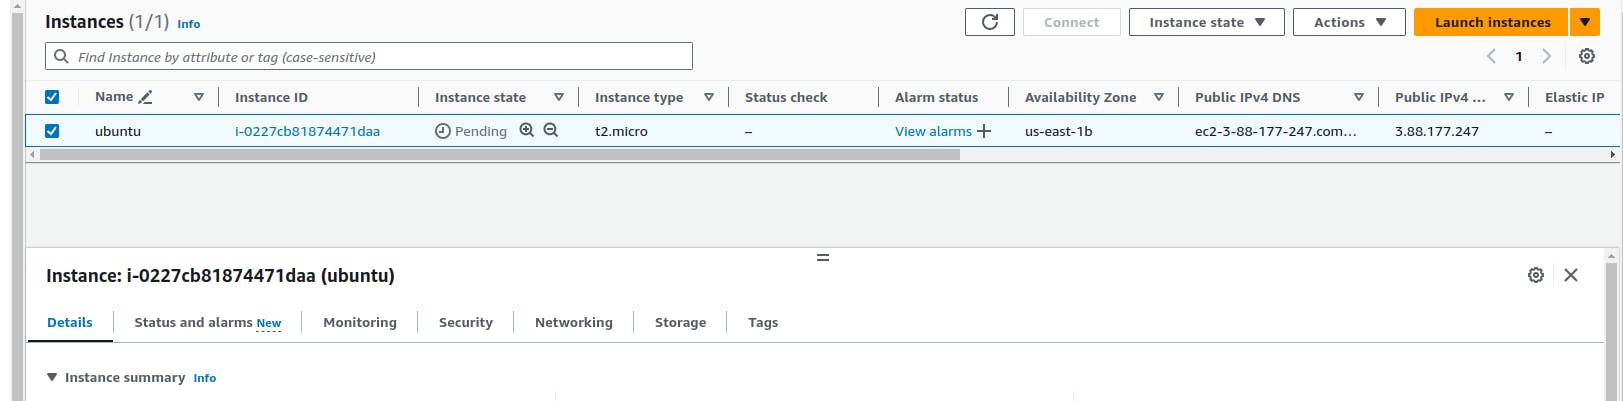
Our instance is created and access the instance using SSH protocol.
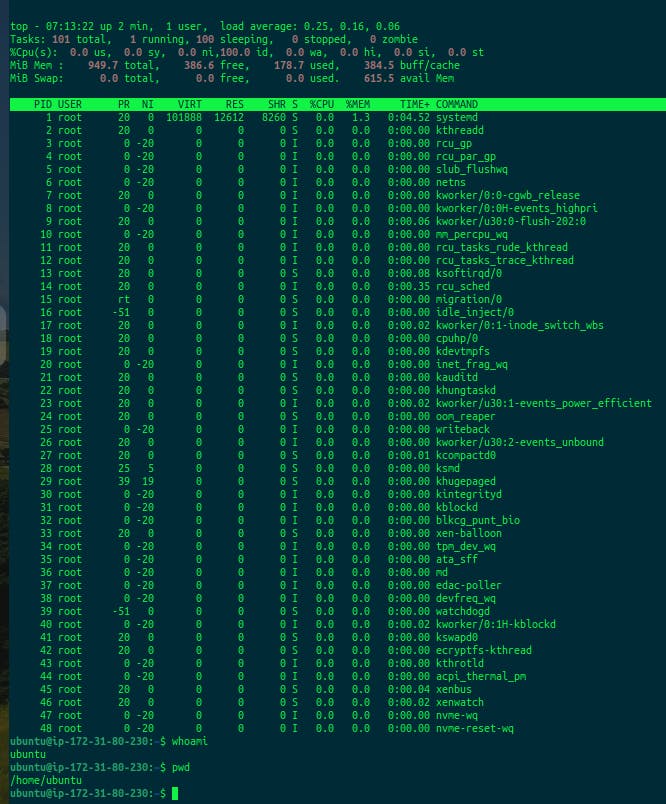
Successfully accessed and run the command "top" to get the resource utilization.
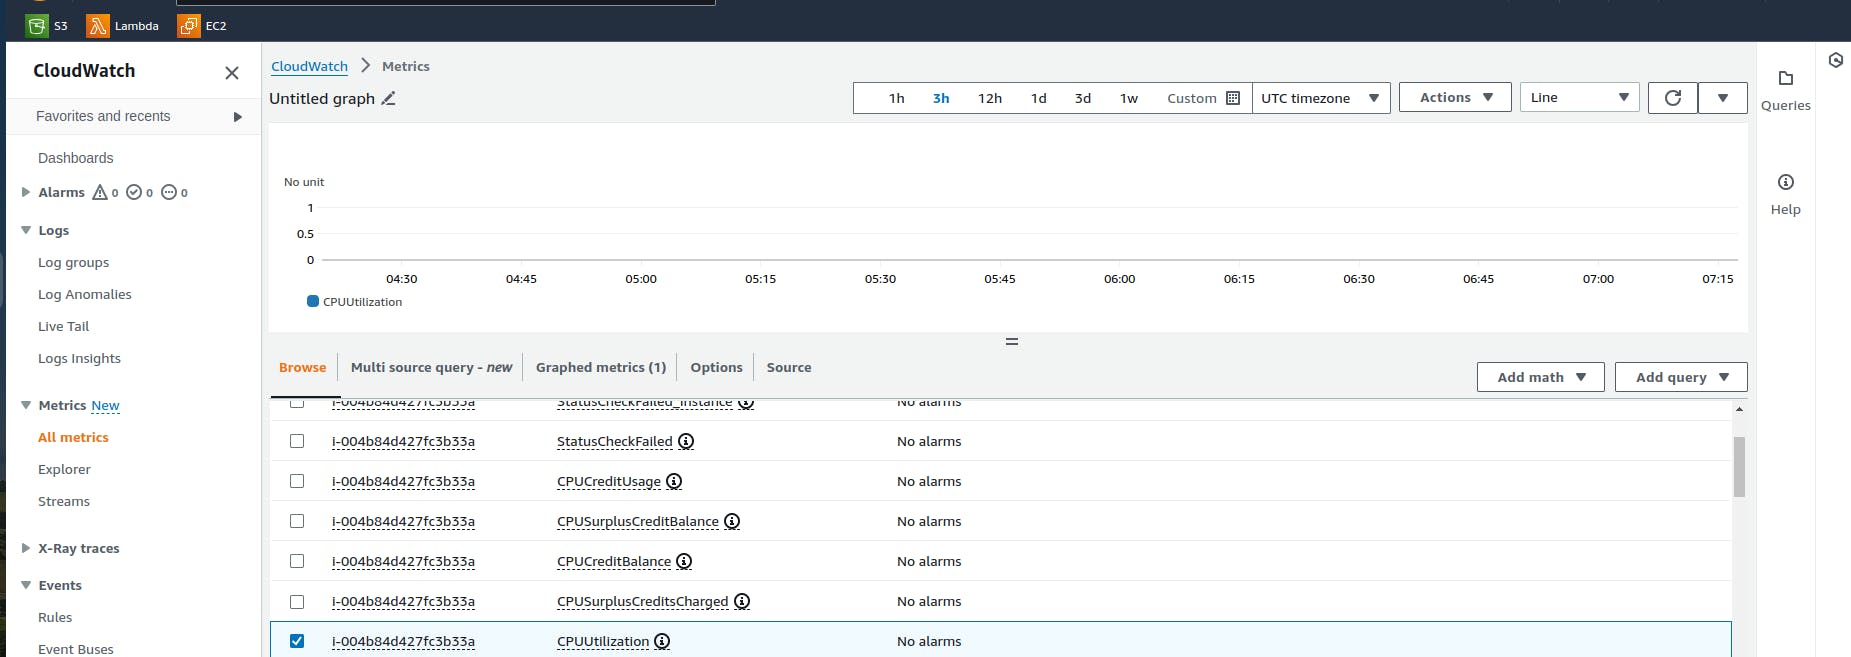
Now move to the cloudwatch and click on metrics, we will choose the ec2 instance.
We have selected the CPU utilization metrics.
Even in the ec2 dashboard, we can see the different monitoring options.
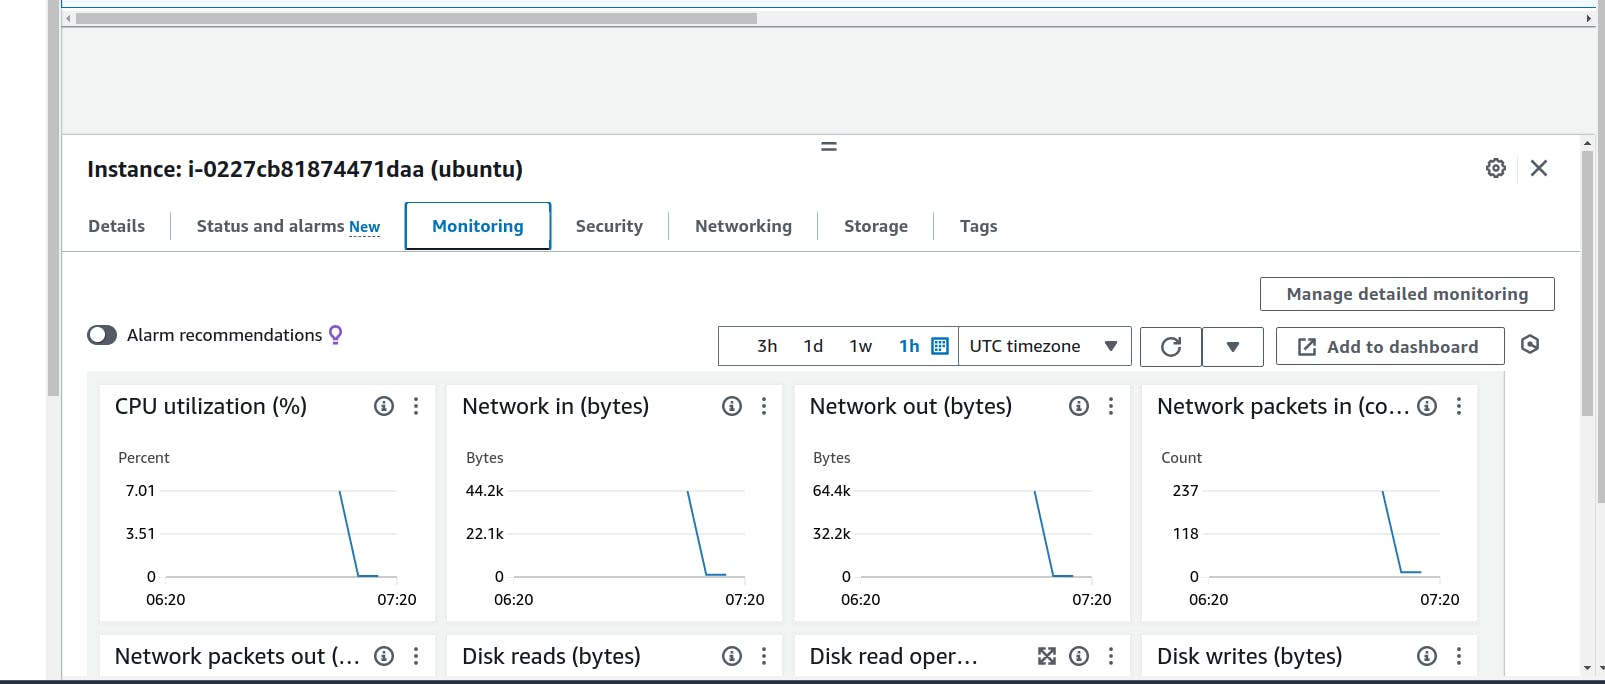
These monitoring are all related to the cloudwatch only. If we click on Manage Detailed Monitoring and enable it, we will get the metric every 1 minute.

In the ec2 instance, we will create a Python program to simulate an increase in CPU usage for testing CloudWatch.

Now after a minute, we will check the Cloudwatch metrics.
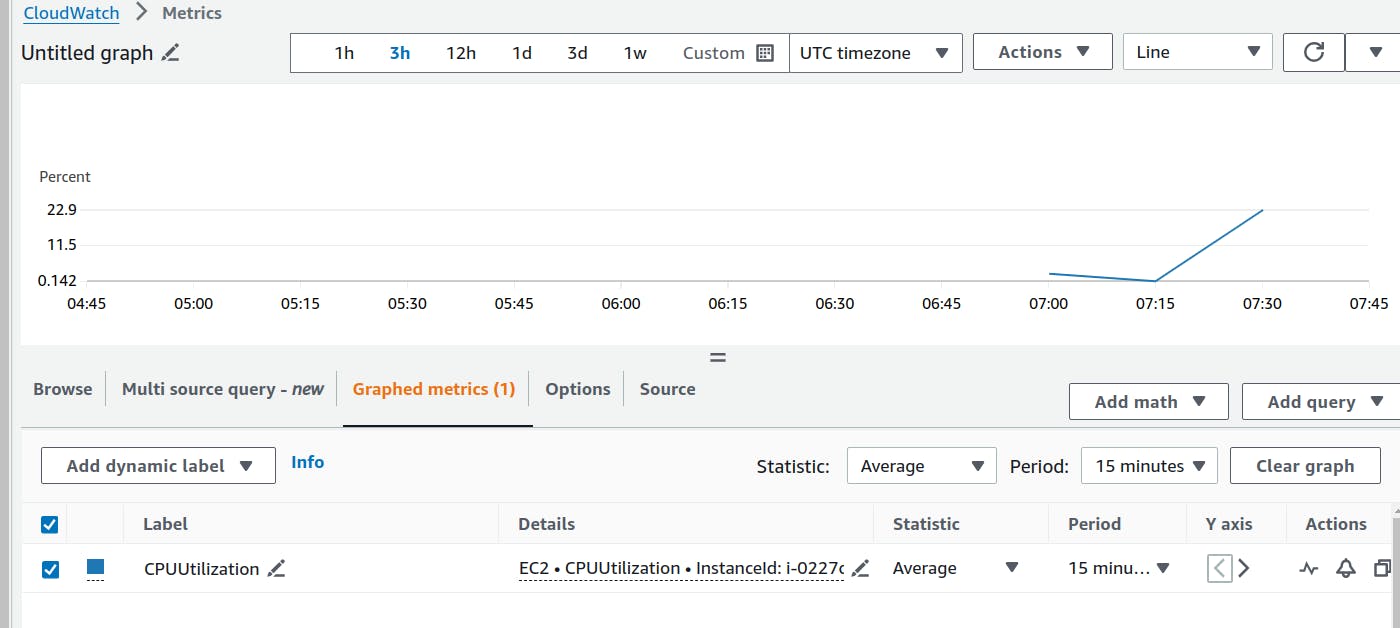
We can see the spikes in the CPU graph.
With metrics, we knew the critical challenges via monitoring but to act upon the metrics is done by the alarm. If the metrics reach a certain point, then the alarm will alert the developers/ admins about the metrics.
Click on Alarms
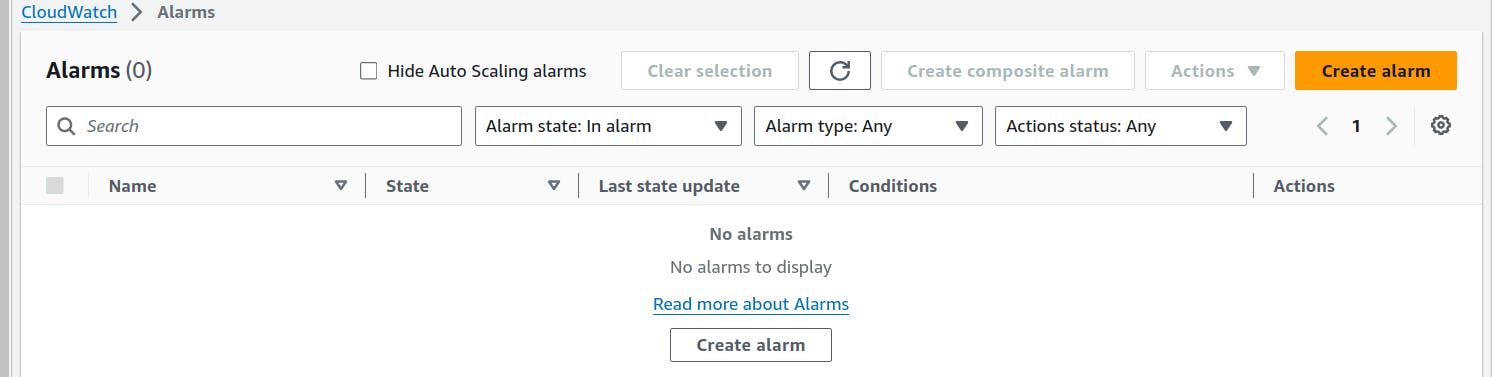
Create the alarm.
Choose to Select a metric > ec2 instance > across all instances/per instance >choose CPU utilization.

We have set the parameters for the alarm. Whenever the CPU spikes 50% or more, the alarm will be sent to the admin/users.
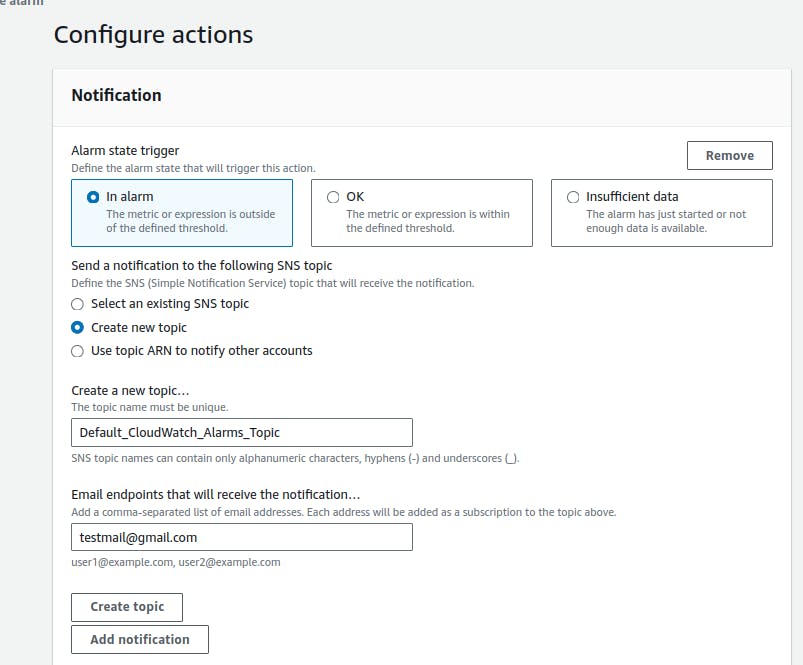
Create the Topic. Click Next.

We have set the message information for the alarm also. Click on create alarm.
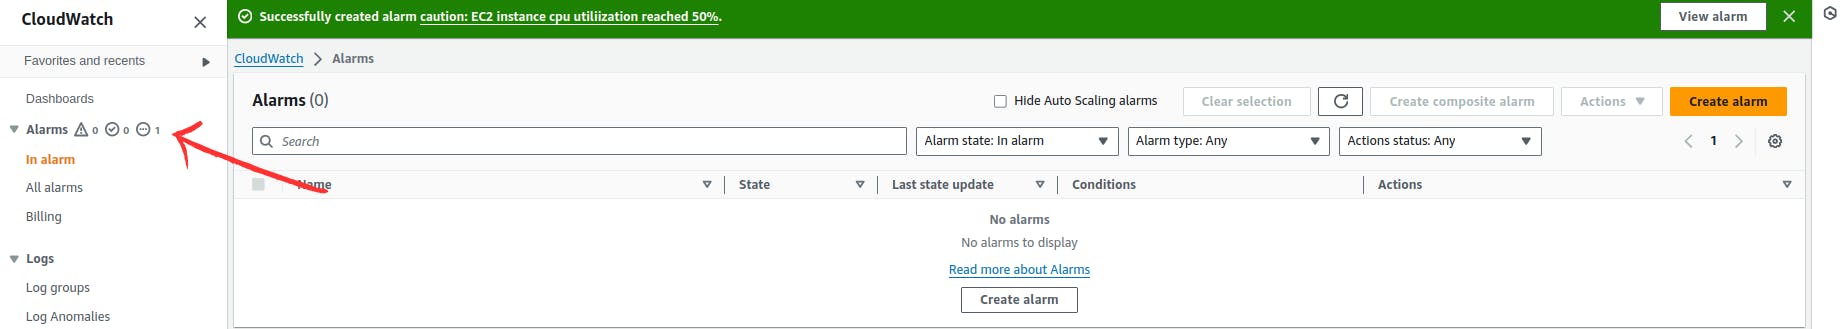
We can see the alarm is not created in the dashboard but the message is alerted. Click here and view the message.

We need to confirm the subscription via email.
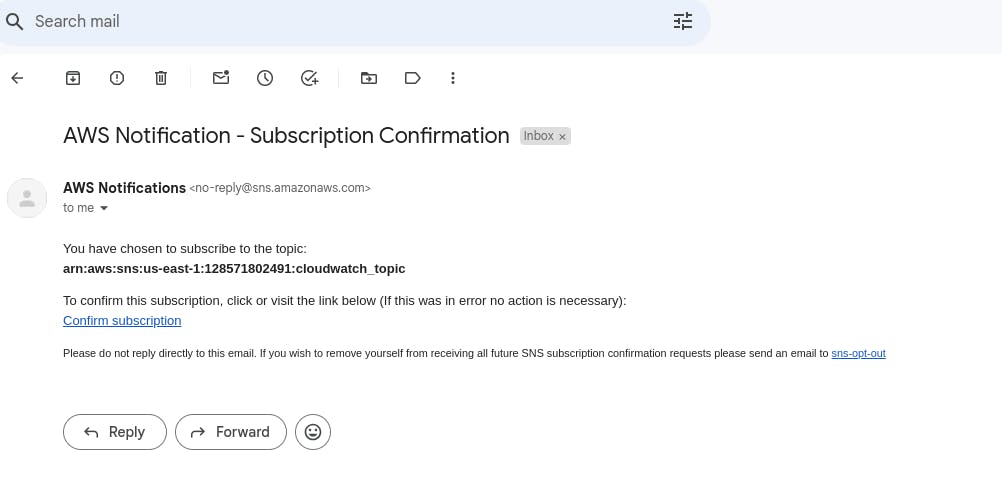
Click on confirm subscription.

Confirmed.
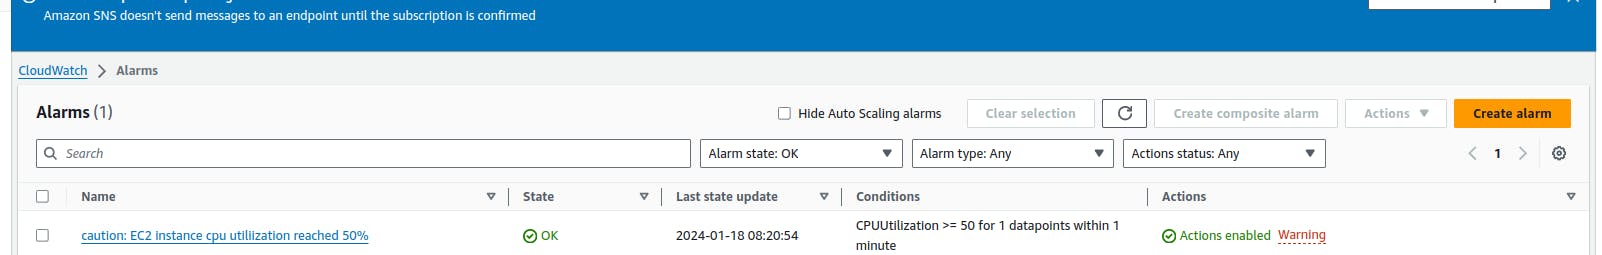
Now it is activated. But we will not get any alarm notification because the alarm is not triggered.
We will trigger it by running the Python script again in our ec2 instance.

We can see the spike has reached above the 50%(threshold). It must send the email regarding this event. Let's check the email.

We have received the mail and it clearly says the CPU utilization reached 50%.
We have successfully configured the ec2 resources and monitored them via the Cloudwatch.
Do not forget to delete the resources
Therefore, AWS CloudWatch stands out as a vital ally in the cloud landscape, offering a centralized and smooth monitoring solution for AWS resources. The practical walkthrough showcased its seamless integration with EC2 instances and the creation of alarms for timely notifications. CloudWatch not only provides comprehensive insights but also empowers users to take meaningful actions, making it an indispensable tool for maintaining optimal performance and ensuring the reliability of AWS resources in dynamic cloud environments.
Happy Learning!!