


In this blog, we will know how to monitor the Kubernetes cluster and
What is a Kubernetes cluster?
A Kubernetes cluster is a system for orchestrating and managing containerized applications, providing a platform for automating the deployment, scaling, and operation of application containers.
The cluster consists of two main components: the master node and worker nodes. The master node controls and manages the overall state of the cluster, including scheduling applications, maintaining cluster configuration, and responding to events. On the other hand, worker nodes host the actual containers and execute the workloads. They communicate with the master node, receive instructions, and ensure that containers are running as intended.
Kubernetes automates tasks such as container scheduling, load balancing, and self-healing, providing a robust and scalable platform for deploying and managing applications across diverse environments.
Why monitoring is required?
Monitoring a Kubernetes cluster is important because it helps you to:
Detect and resolve issues with the cluster and its applications before they become major problems
Optimize the performance of the cluster and its applications by identifying bottlenecks and other inefficiencies
Track the health and utilization of cluster resources such as nodes, pods, deployments, and persistent storage
How monitoring of the Kubernetes Cluster is done?
In this blog, monitoring of the Kubernetes cluster will be done using Prometheus and Grafana. It involves deploying Prometheus within the cluster to collect metrics from various components and store them in a time-series database.
Grafana is then installed to create customized dashboards that visualize real-time metrics fetched from Prometheus. This monitoring stack is often set up using Helm charts, simplifying deployment and configuration.
Let's delve into the monitoring of clusters practically.
Start the Minikube cluster
minikube start
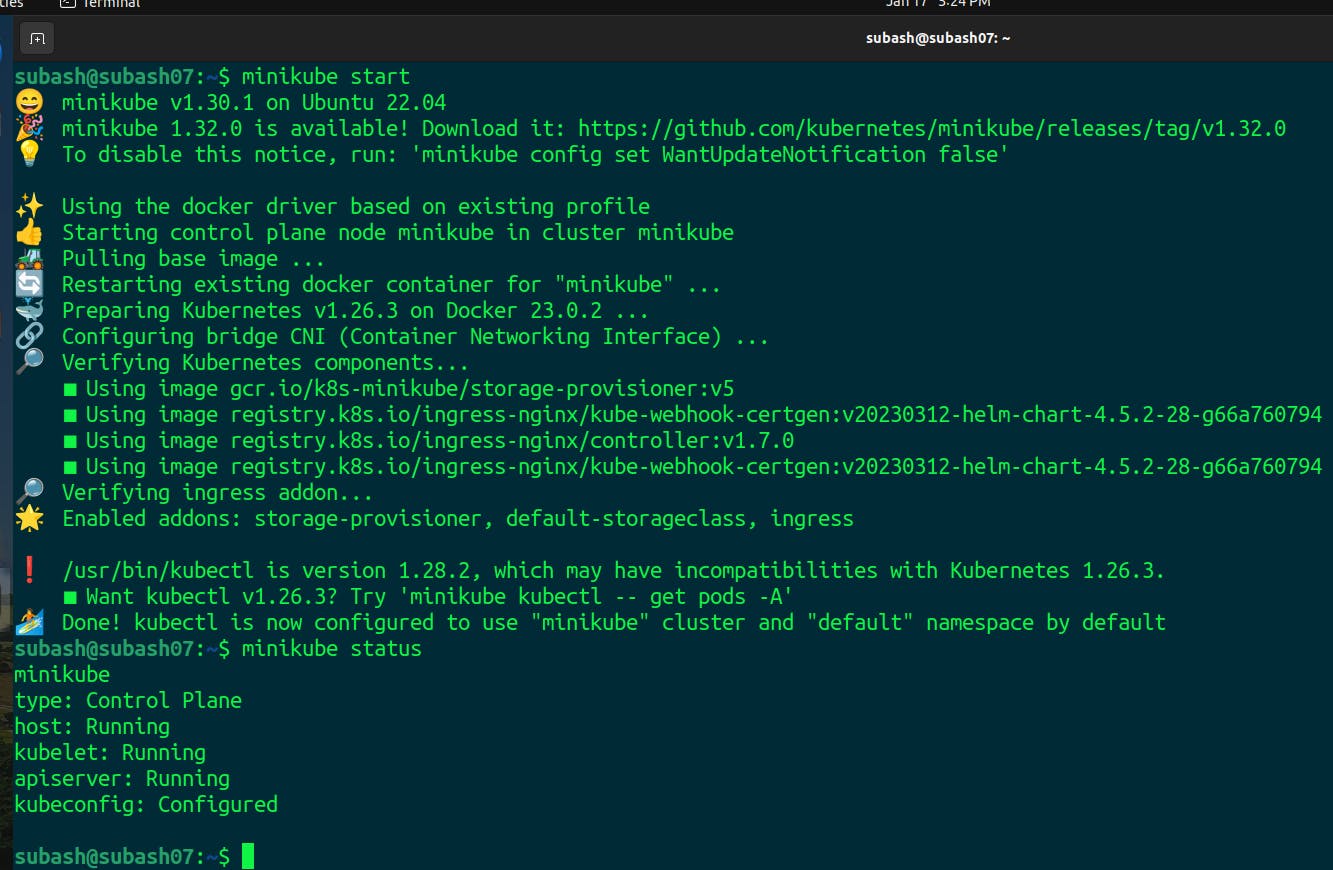
Our local cluster is ready using the Minikube and it is in running state.
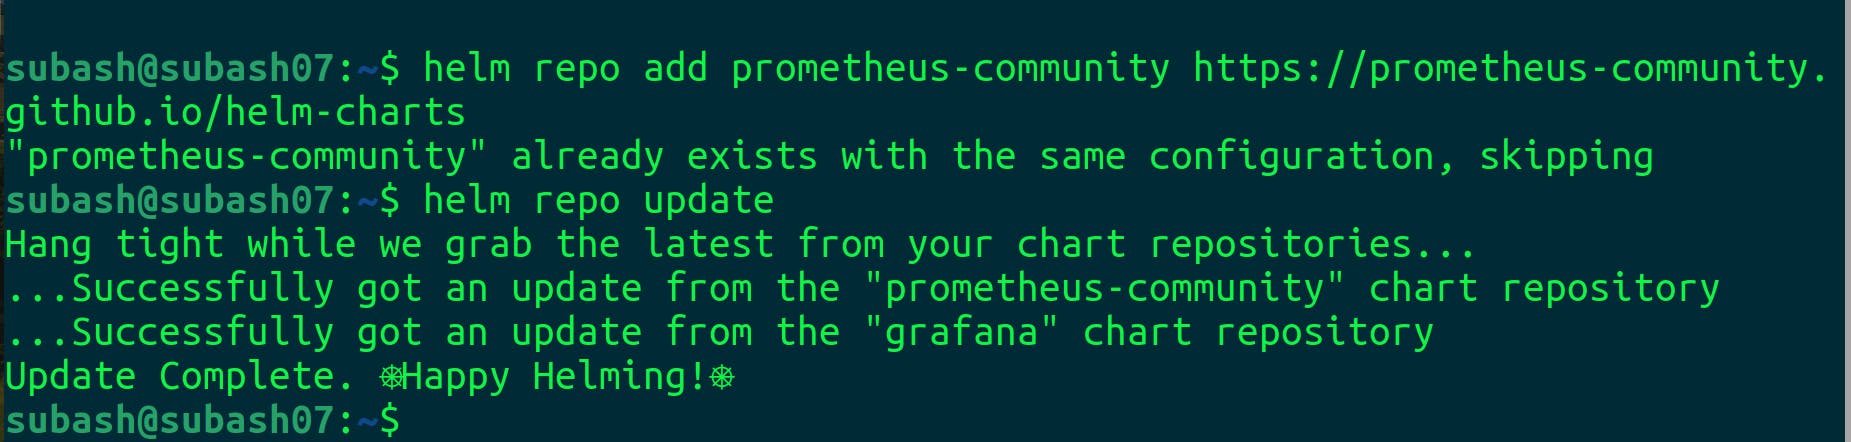
We will install the Prometheus and Grafana using the helm. If the helm is not installed use this link.
Add the Helm chart for Prometheus
helm repo add prometheus-community https://prometheus-community.github.io/helm-charts
Update the Helm repo for the latest updates
helm repo update
Install the Prometheus
helm install prometheus prometheus-community/prometheus
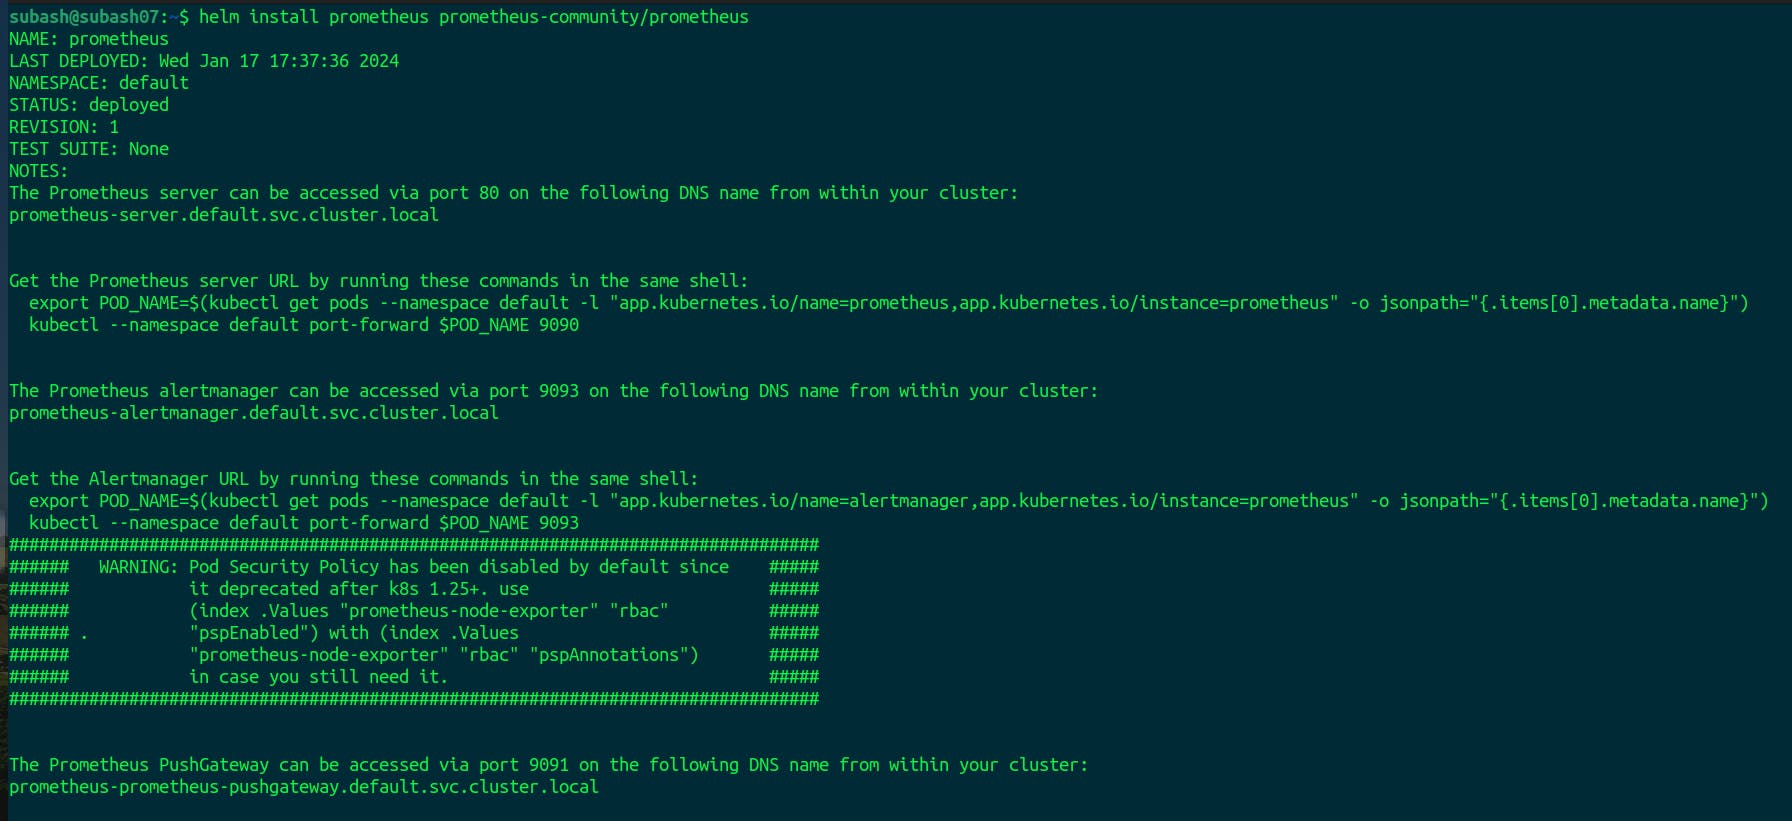
Our Prometheus is installed and can be accessed via port 9091
Let's verify the Prometheus installation
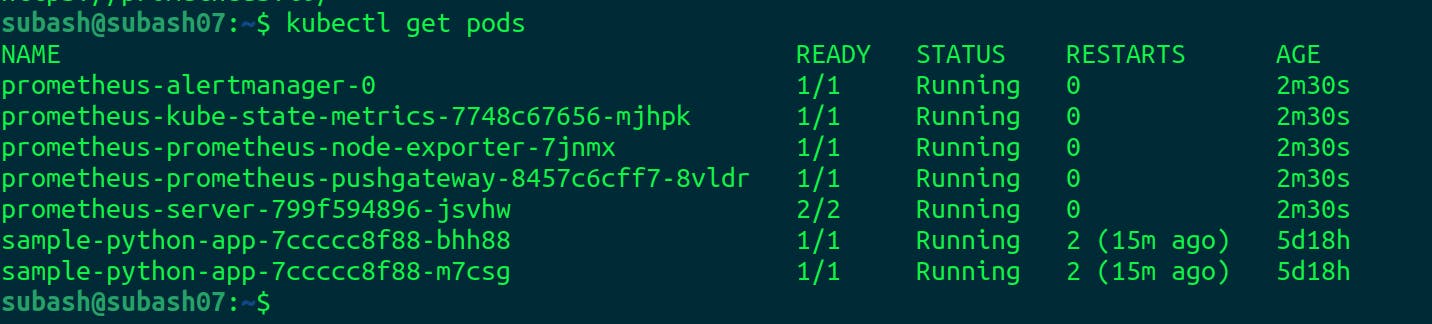
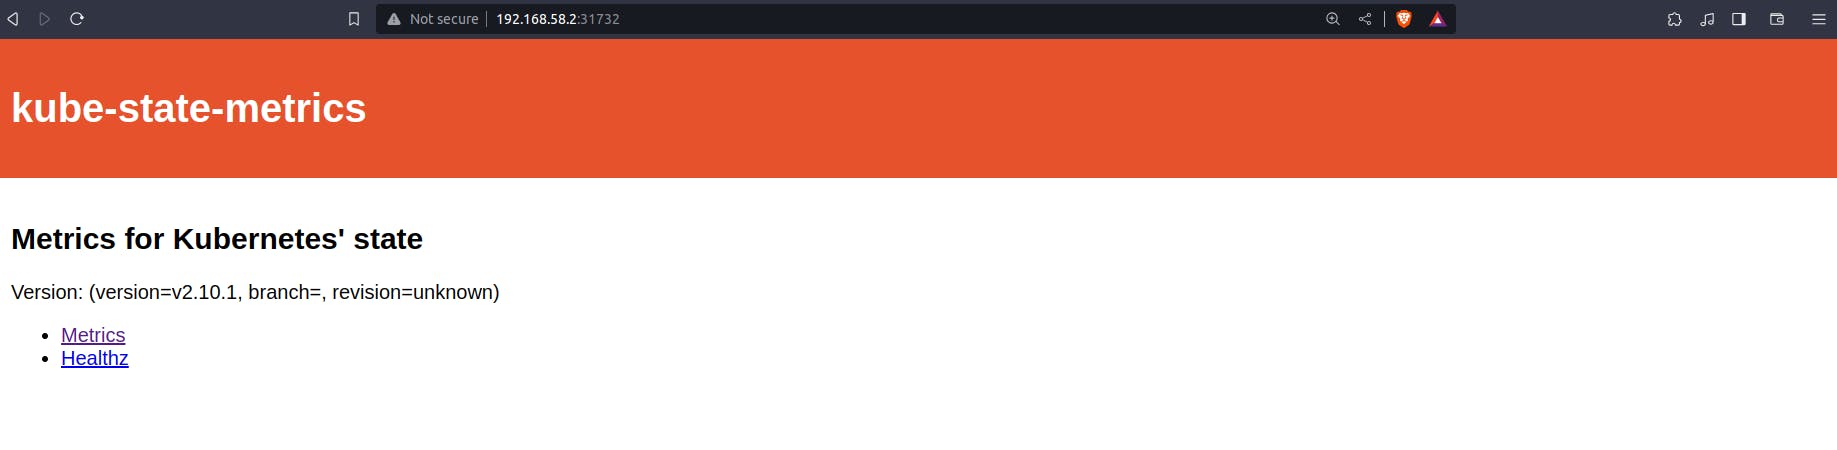
The Prometheus pods are running along with the Prometheus server. Kube-state-metrics as seen in the image is used to expose some Kubernetes metrices like API servers, deployments, pods, etc.
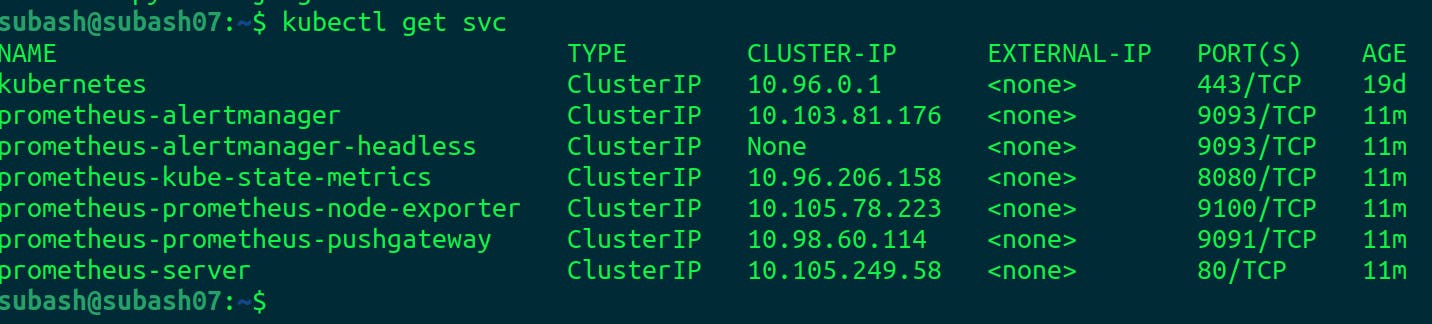
The Prometheus server is created using the ClusterIP mode. Let's convert this service into a Nodeport service.
Expose Prometheus Service
kubectl expose service prometheus-server --type=NodePort --target-port=9090 --name=prometheus-server-ext
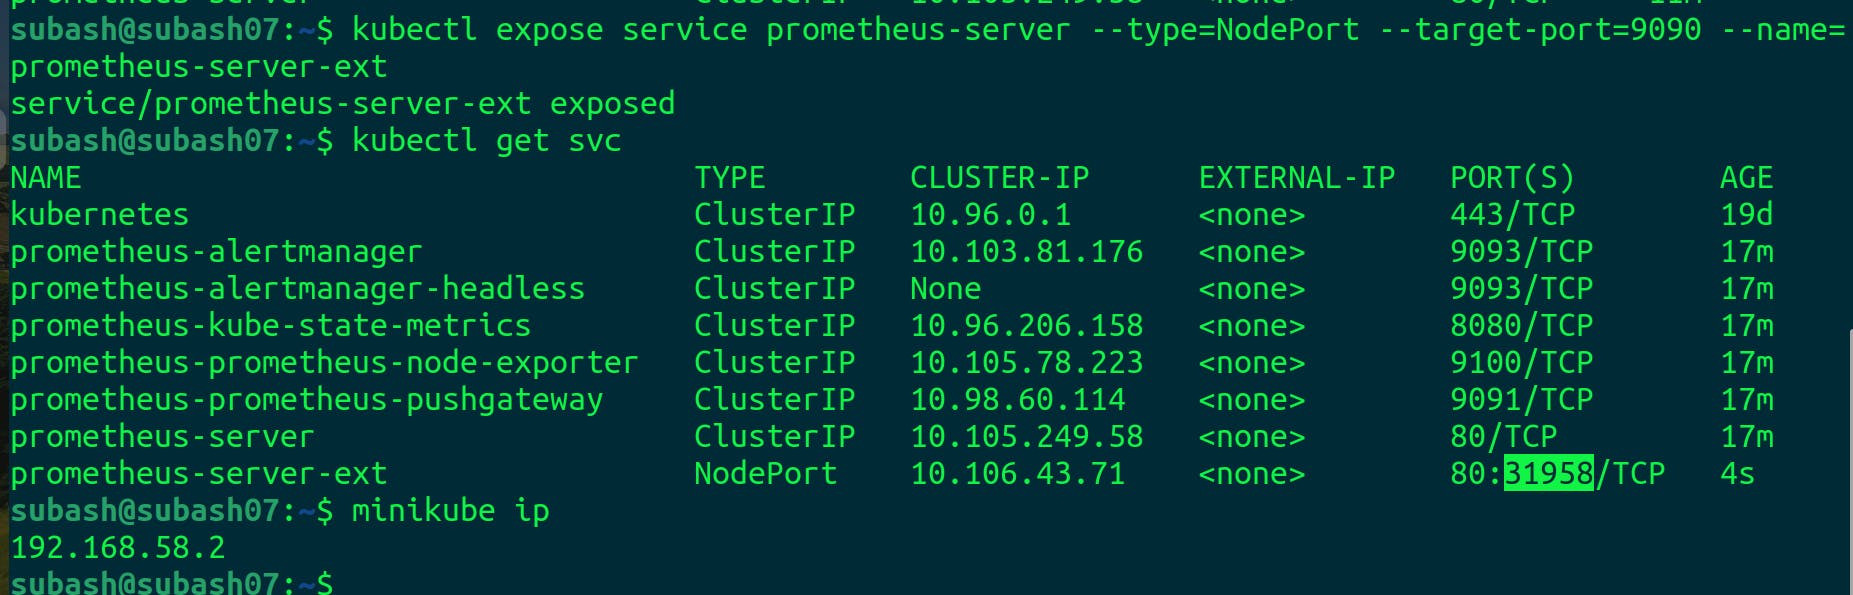
We exposed the Prometheus server using the node port and got the Kubernetes cluster ip using Minikube IP. Now we will access the Prometheus using http://192.168.58.2:31958
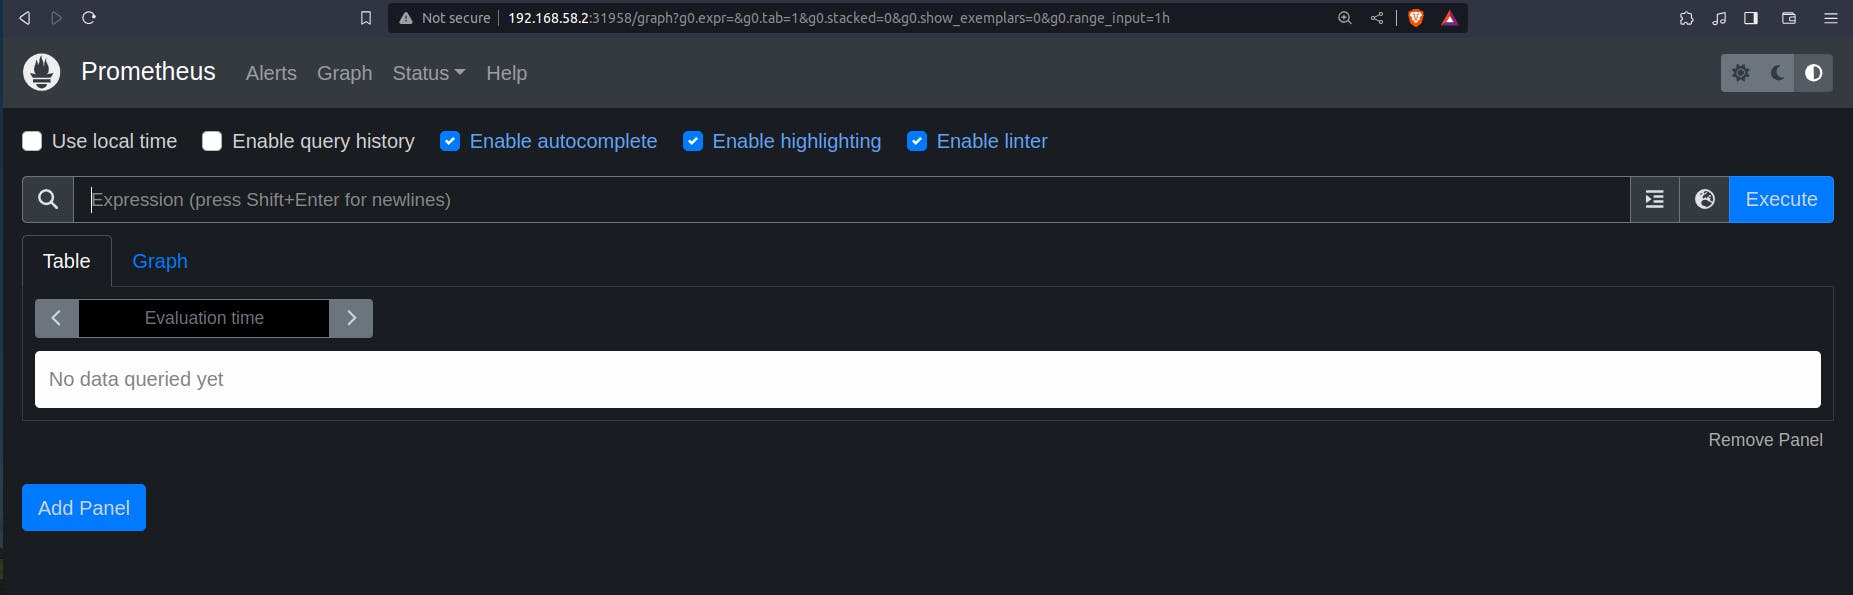
Our Prometheus server is ready to serve. The first step for monitoring the cluster is done.
Grafana
Add the helm repo
helm repo add grafana https://grafana.github.io/helm-charts
Update the helm repo
helm repo update
Install the Grafana
helm install grafana grafana/grafana
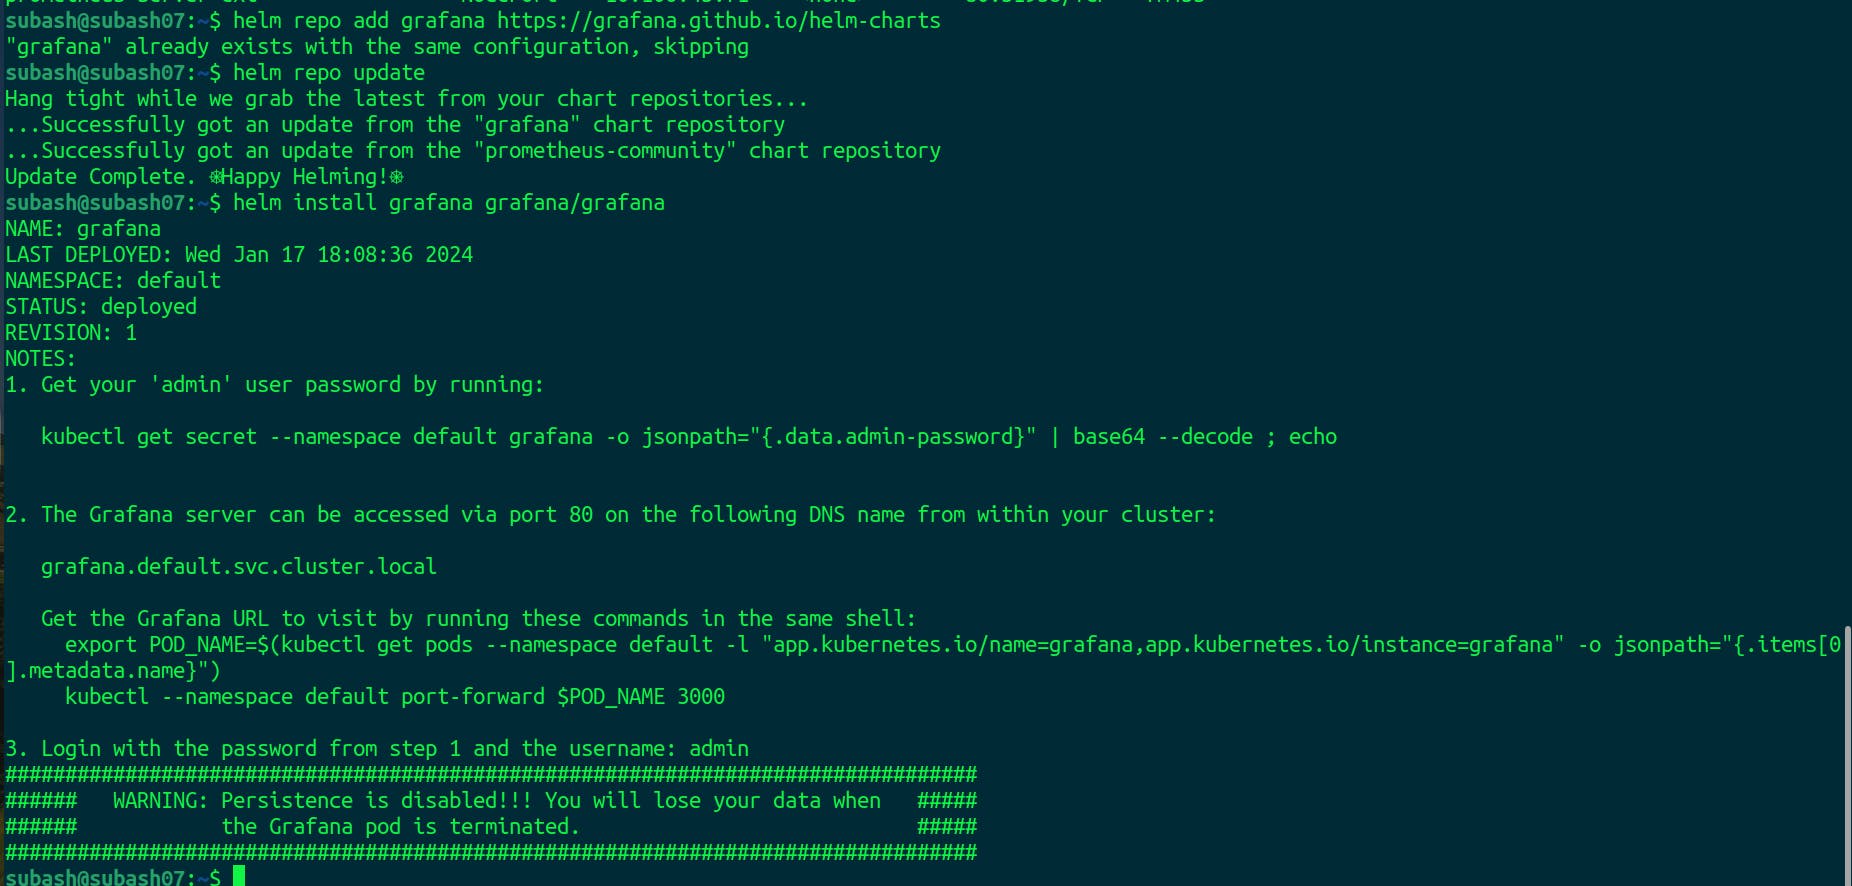
So our Grafana is installed and running.
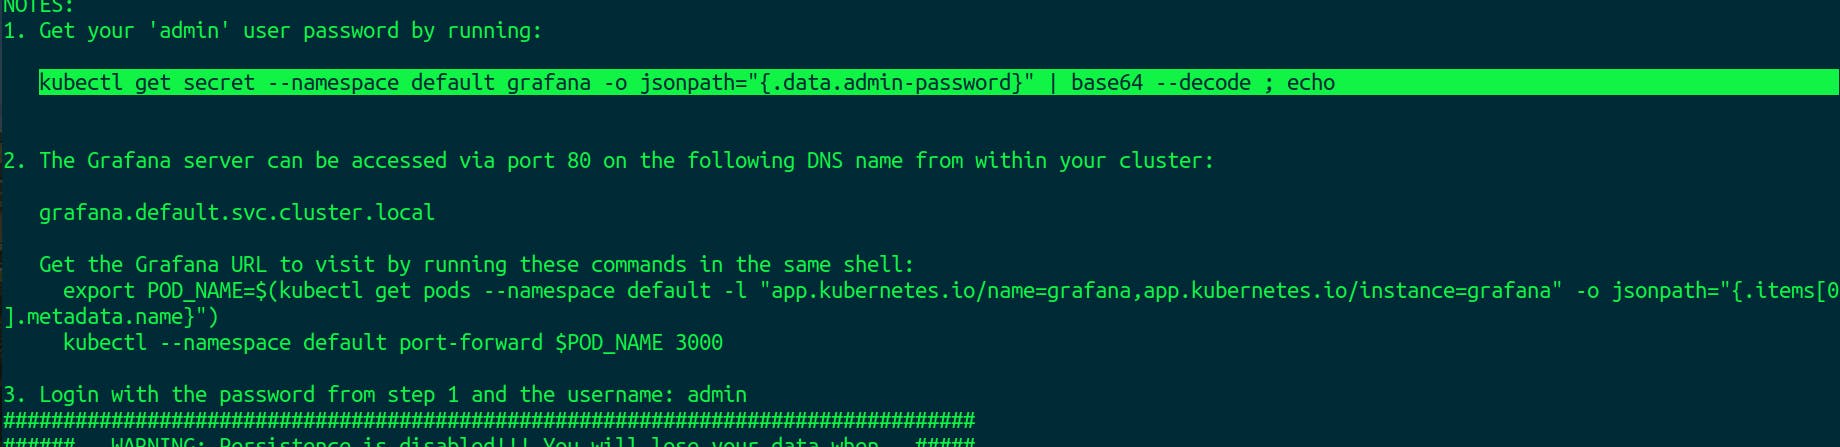
To get the password for the Grafana run the command as shown in the reference image.
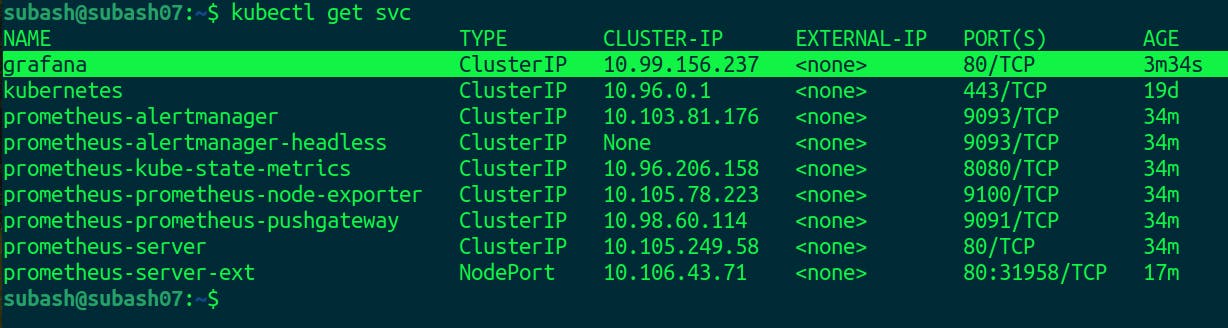
We can see that the grafana is running in the ClusterIP.
Expose the Grafana
kubectl expose service grafana — type=NodePort — target-port=3000 — name=grafana-ext
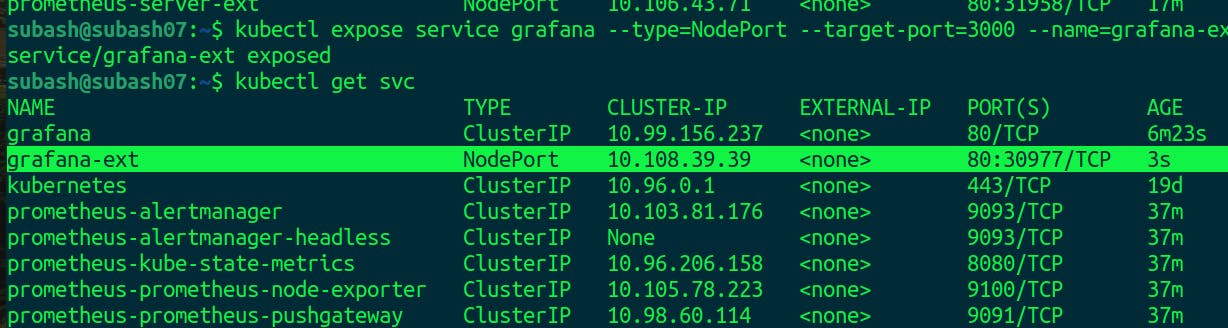
Grafana is exposed.
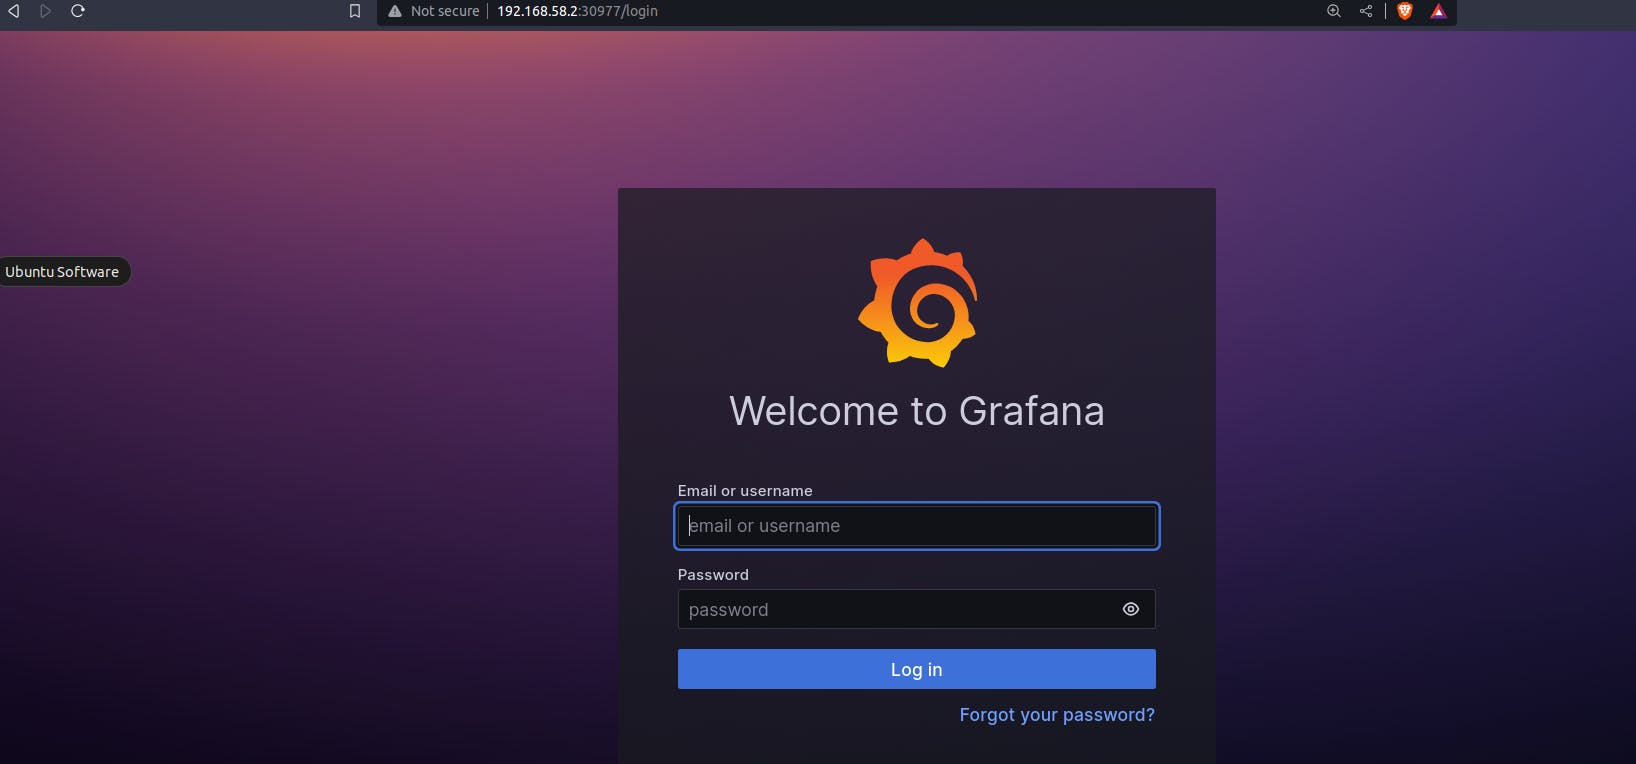
We can easily access the Grafana login page.
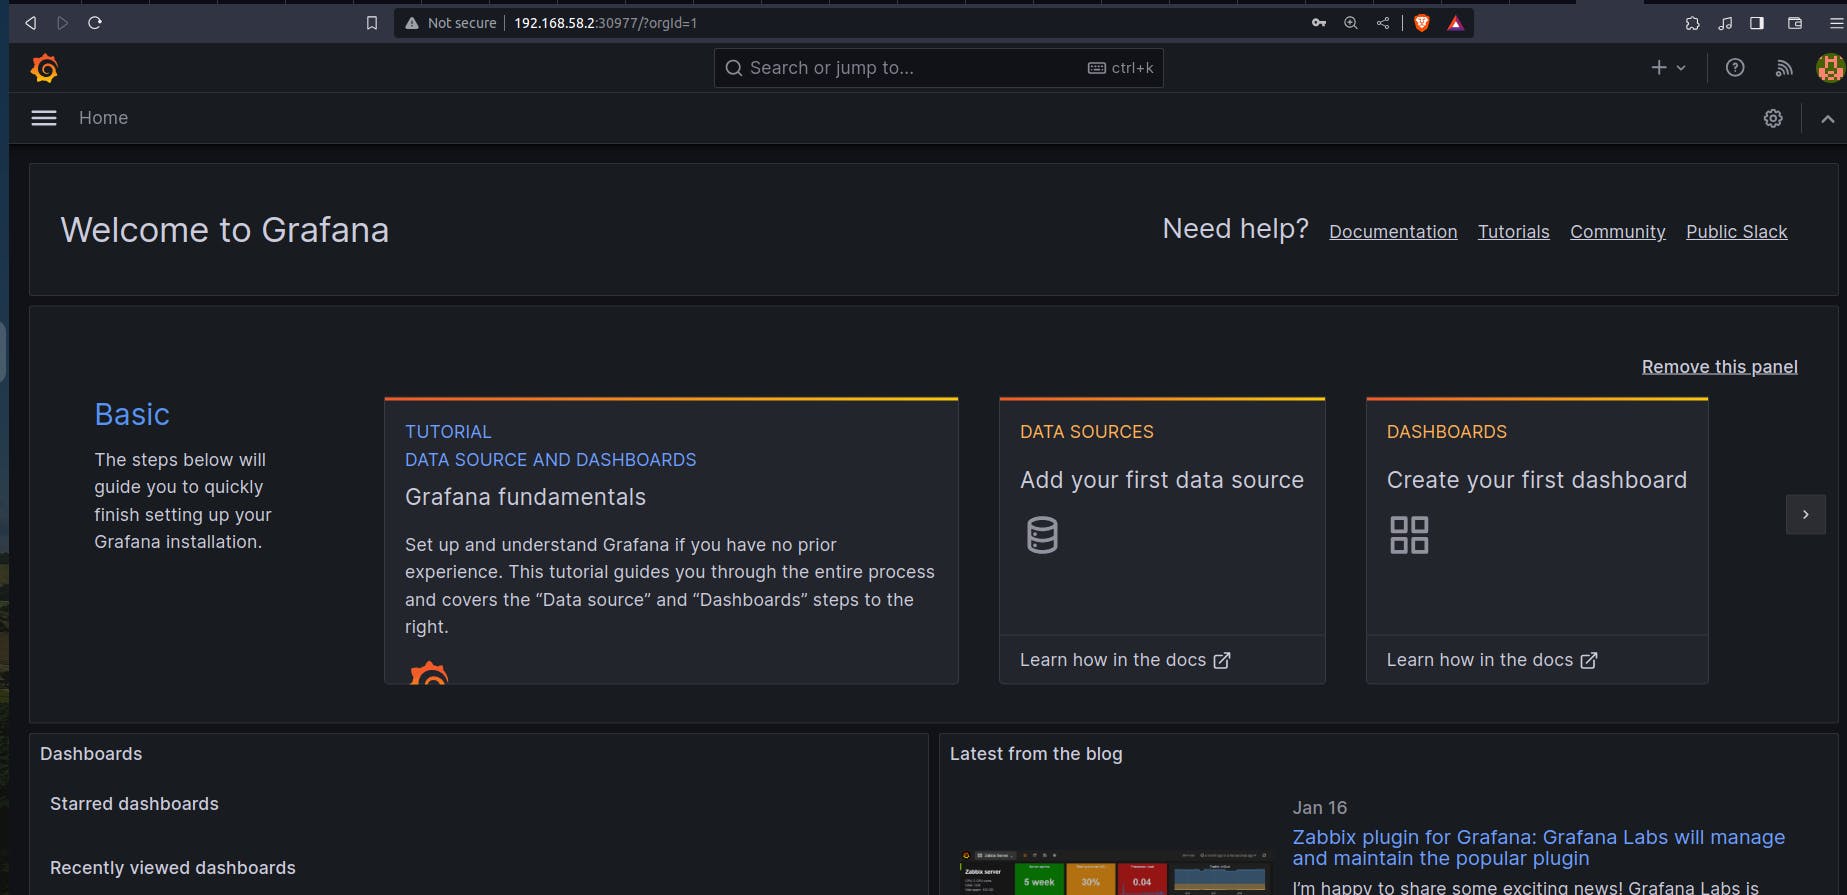
Successfully logged into the Grafana dashboard.
Now we will add Prometheus as the data source.
Click on Data Source > choose Prometheus.
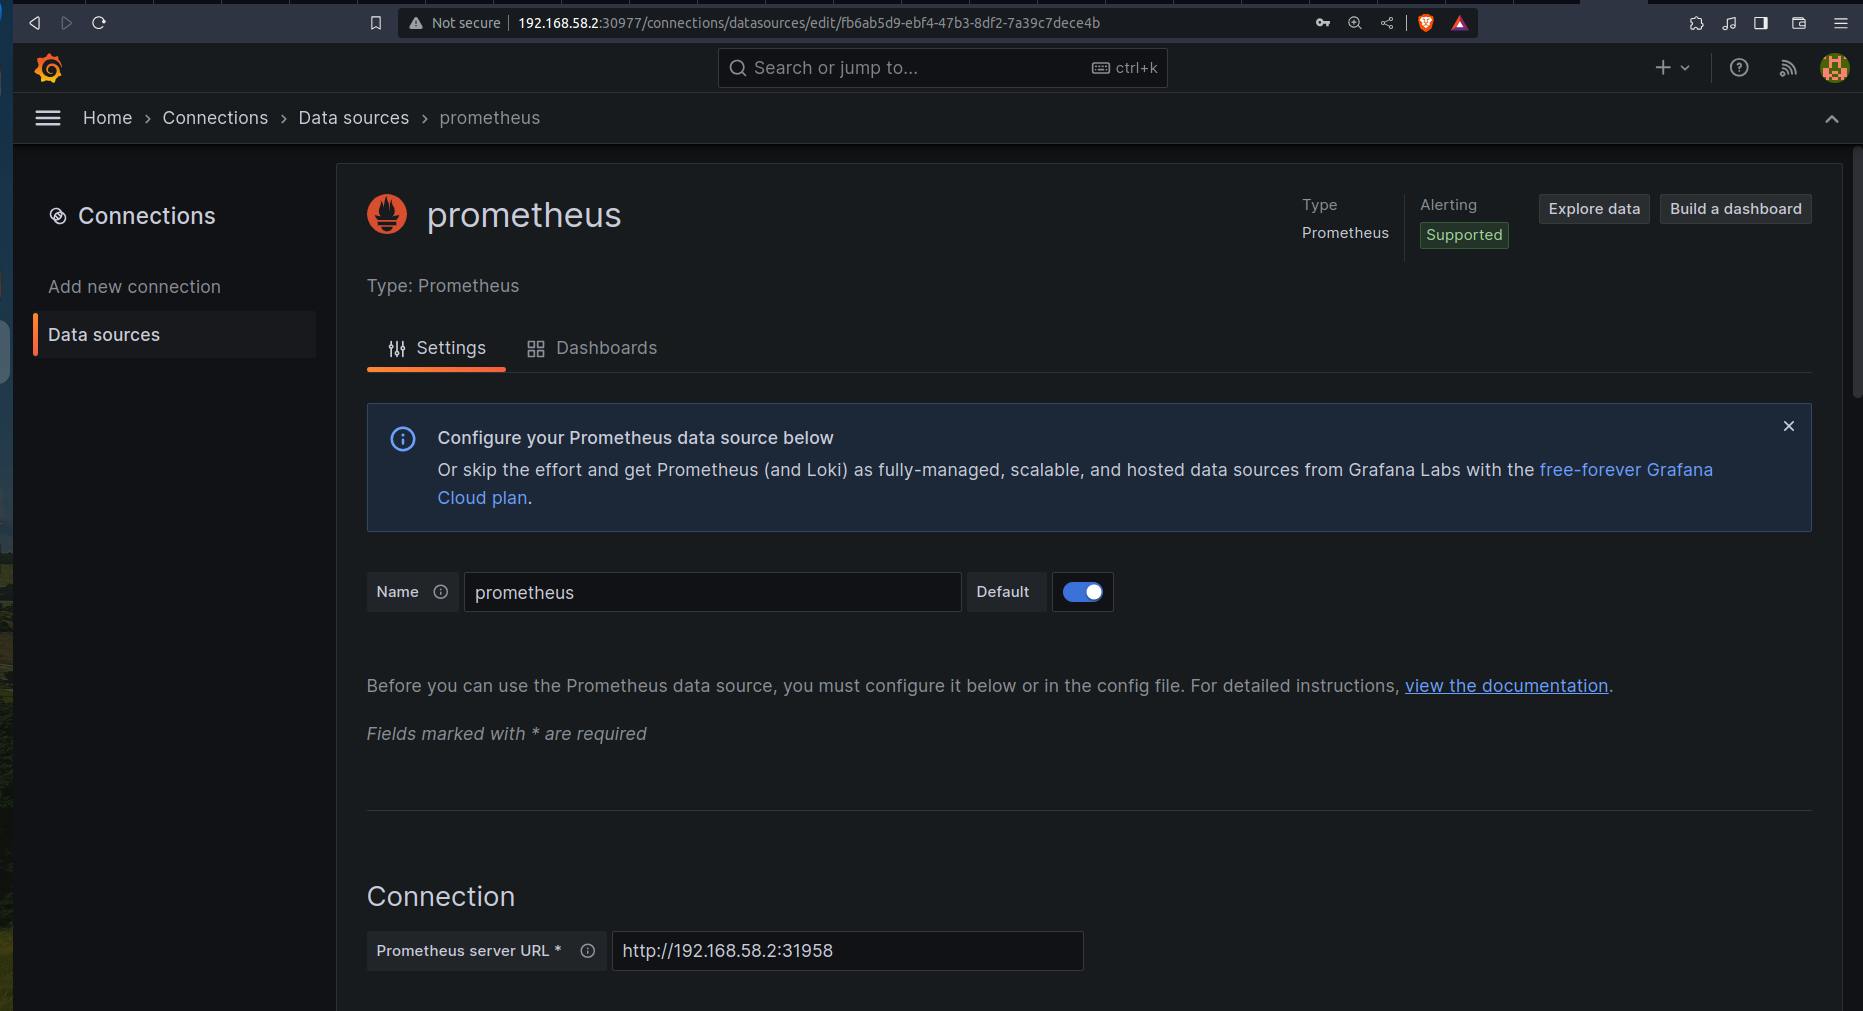
In the connection: insert the Prometheus URL.
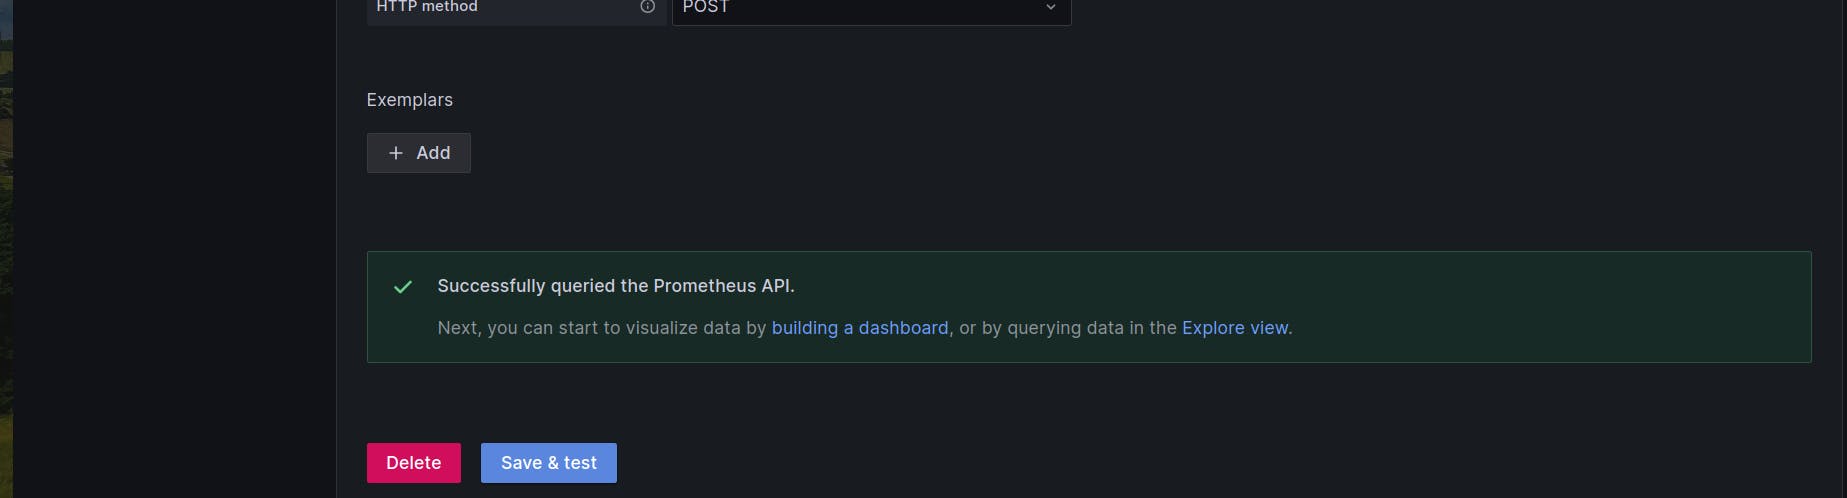
Click on Save and test.
Now click on Building a dashboard or from the homepage we can create the dashboard.
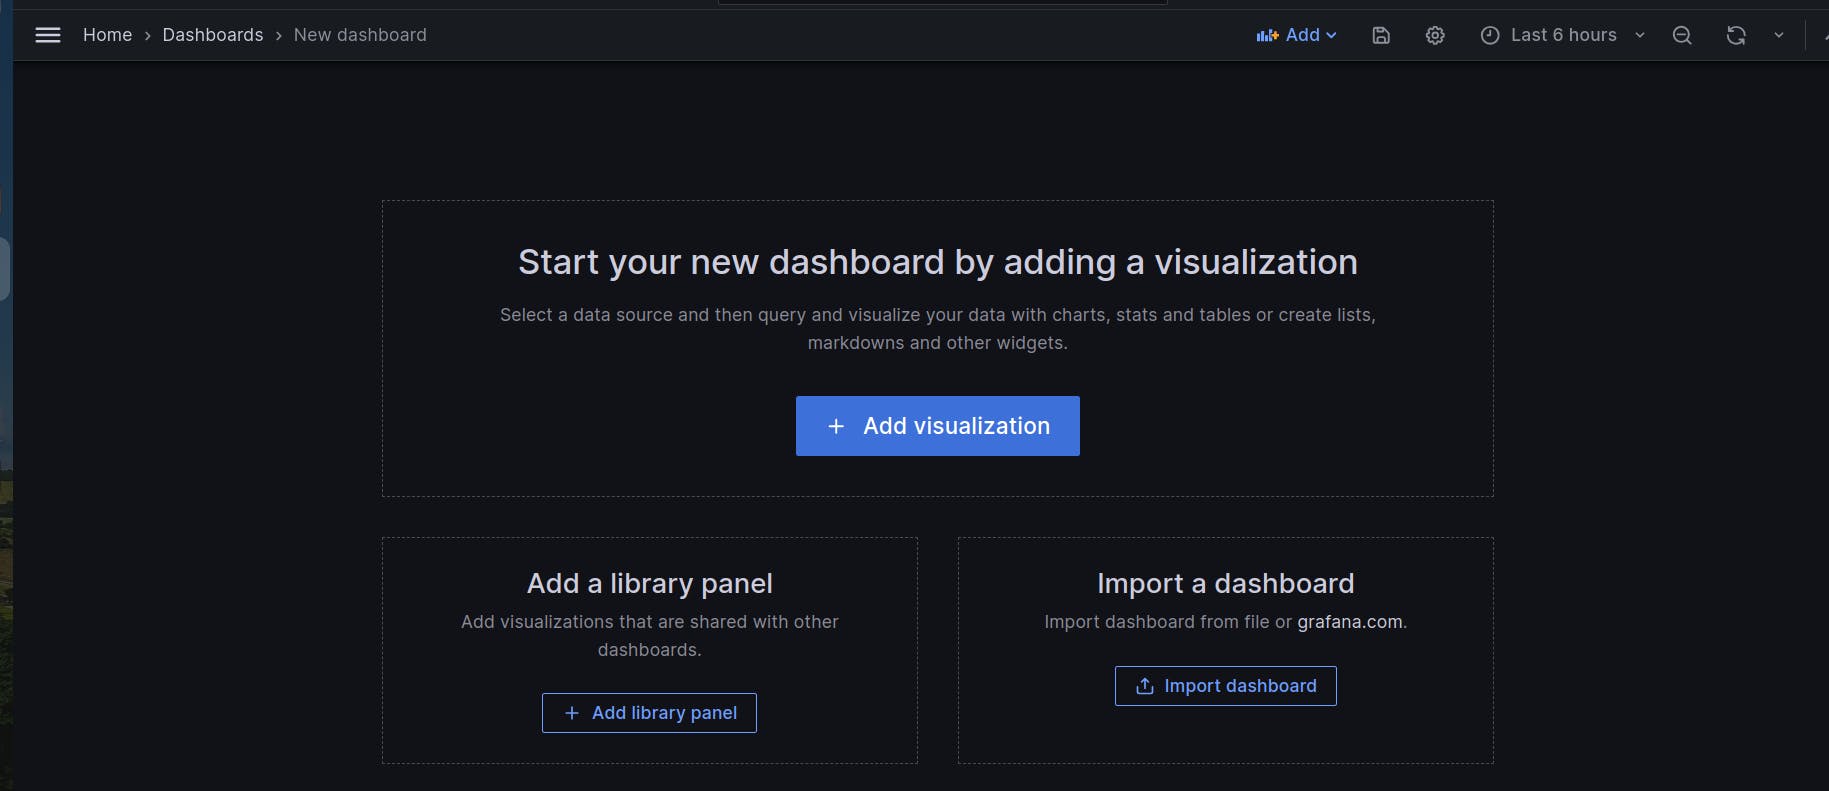
Instead of creating the dashboard from the beginning, we can simply import the dashboard that is already pre-built.
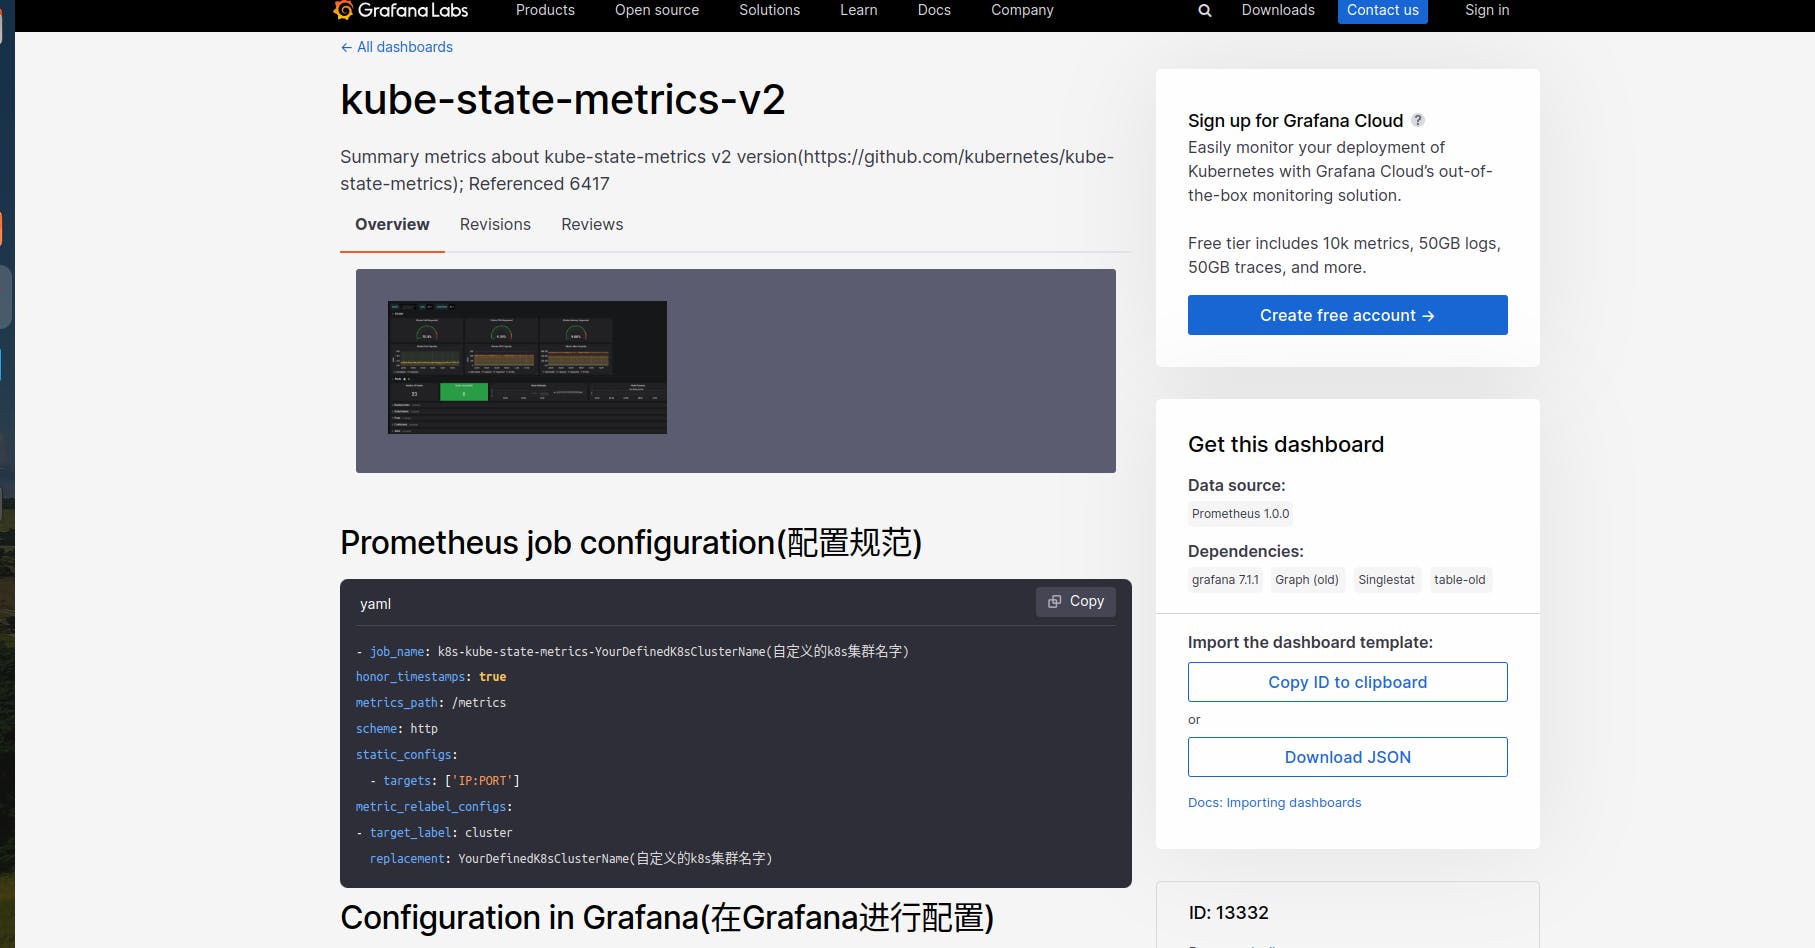
From here we can copy the ID of the dashboard i.e. 13332
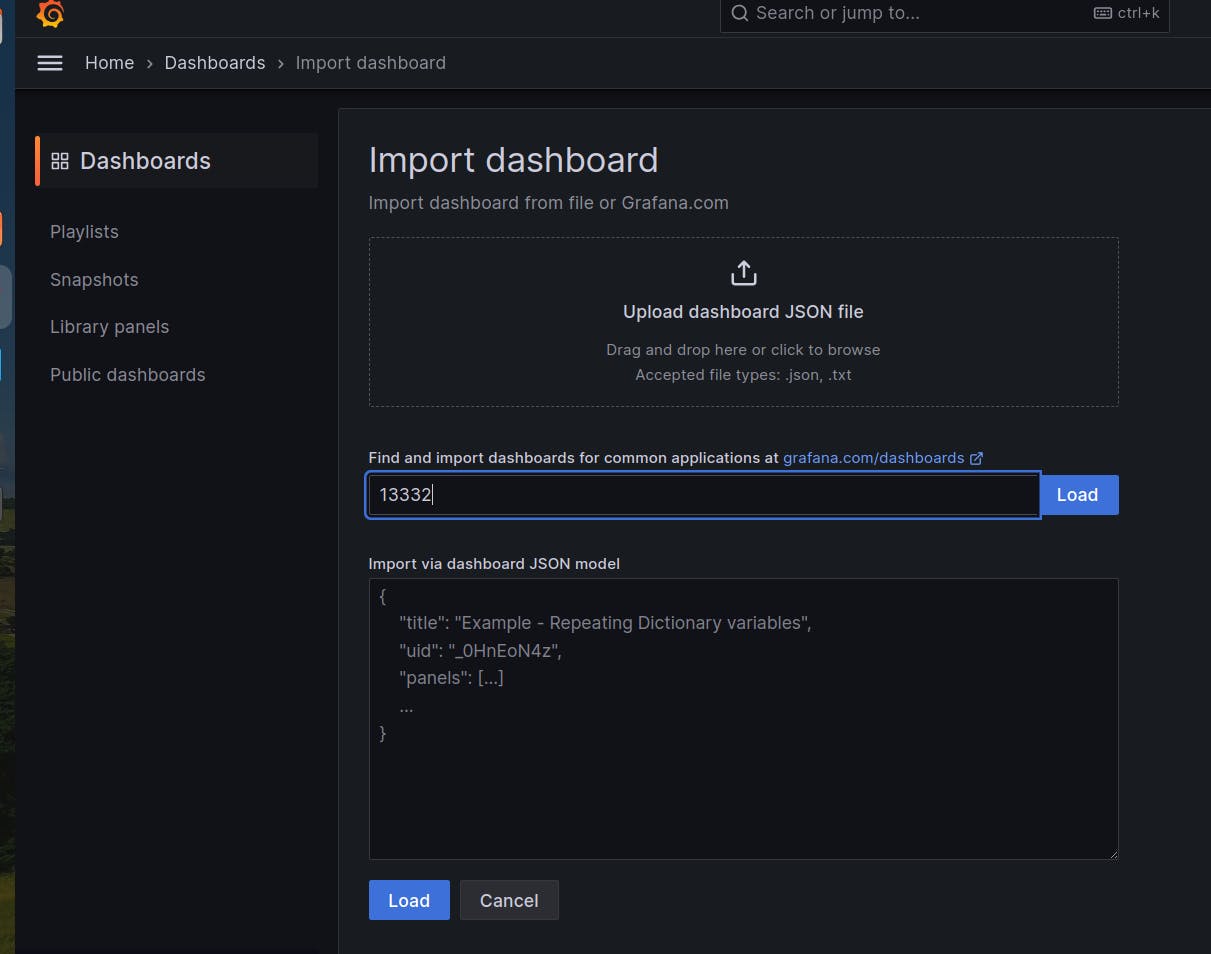
Click on load to load the dashboard.
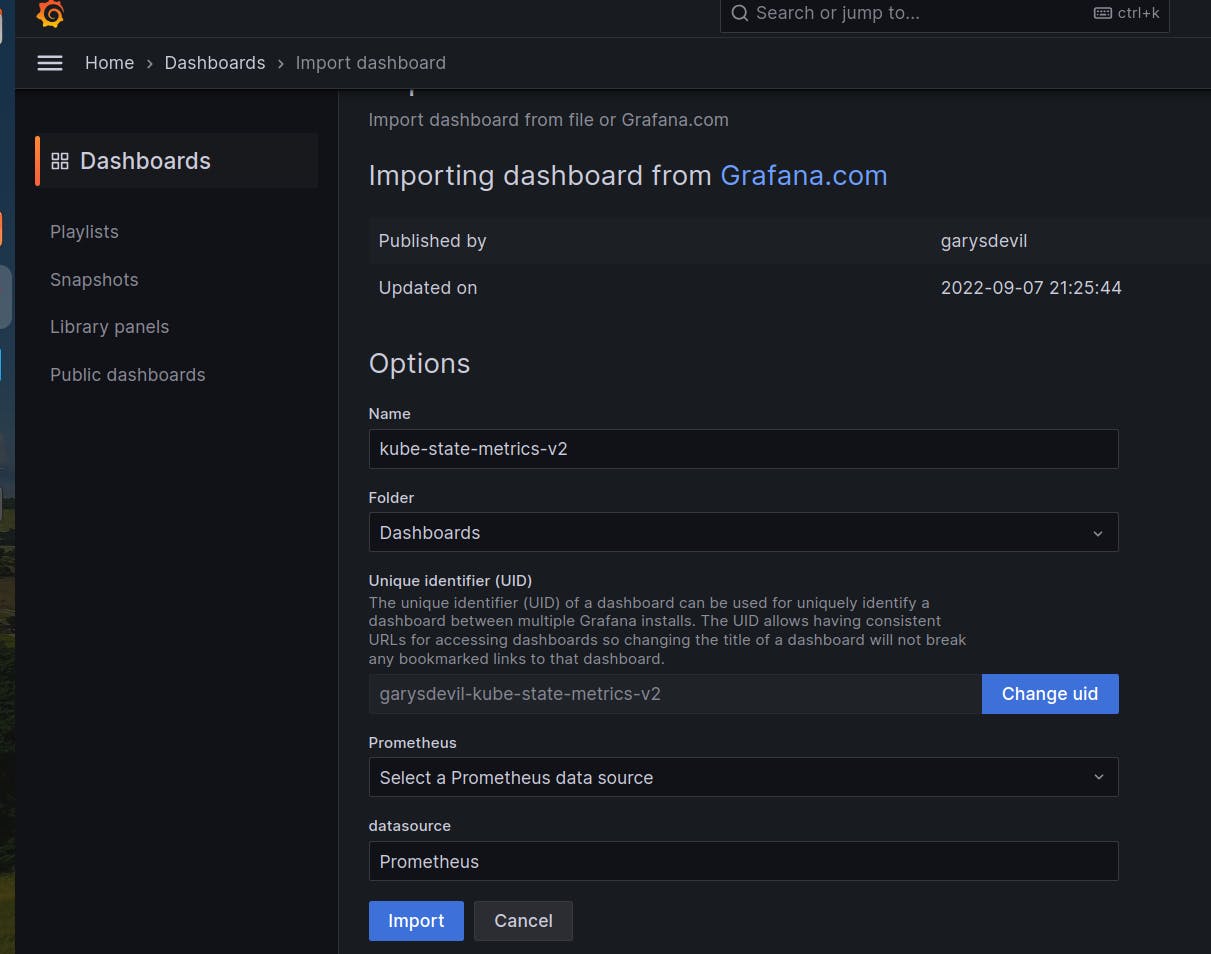
Click on Import.
You can import the multiple dashboards.
Using the id:15282
And the Dashboard can be visualized as below.
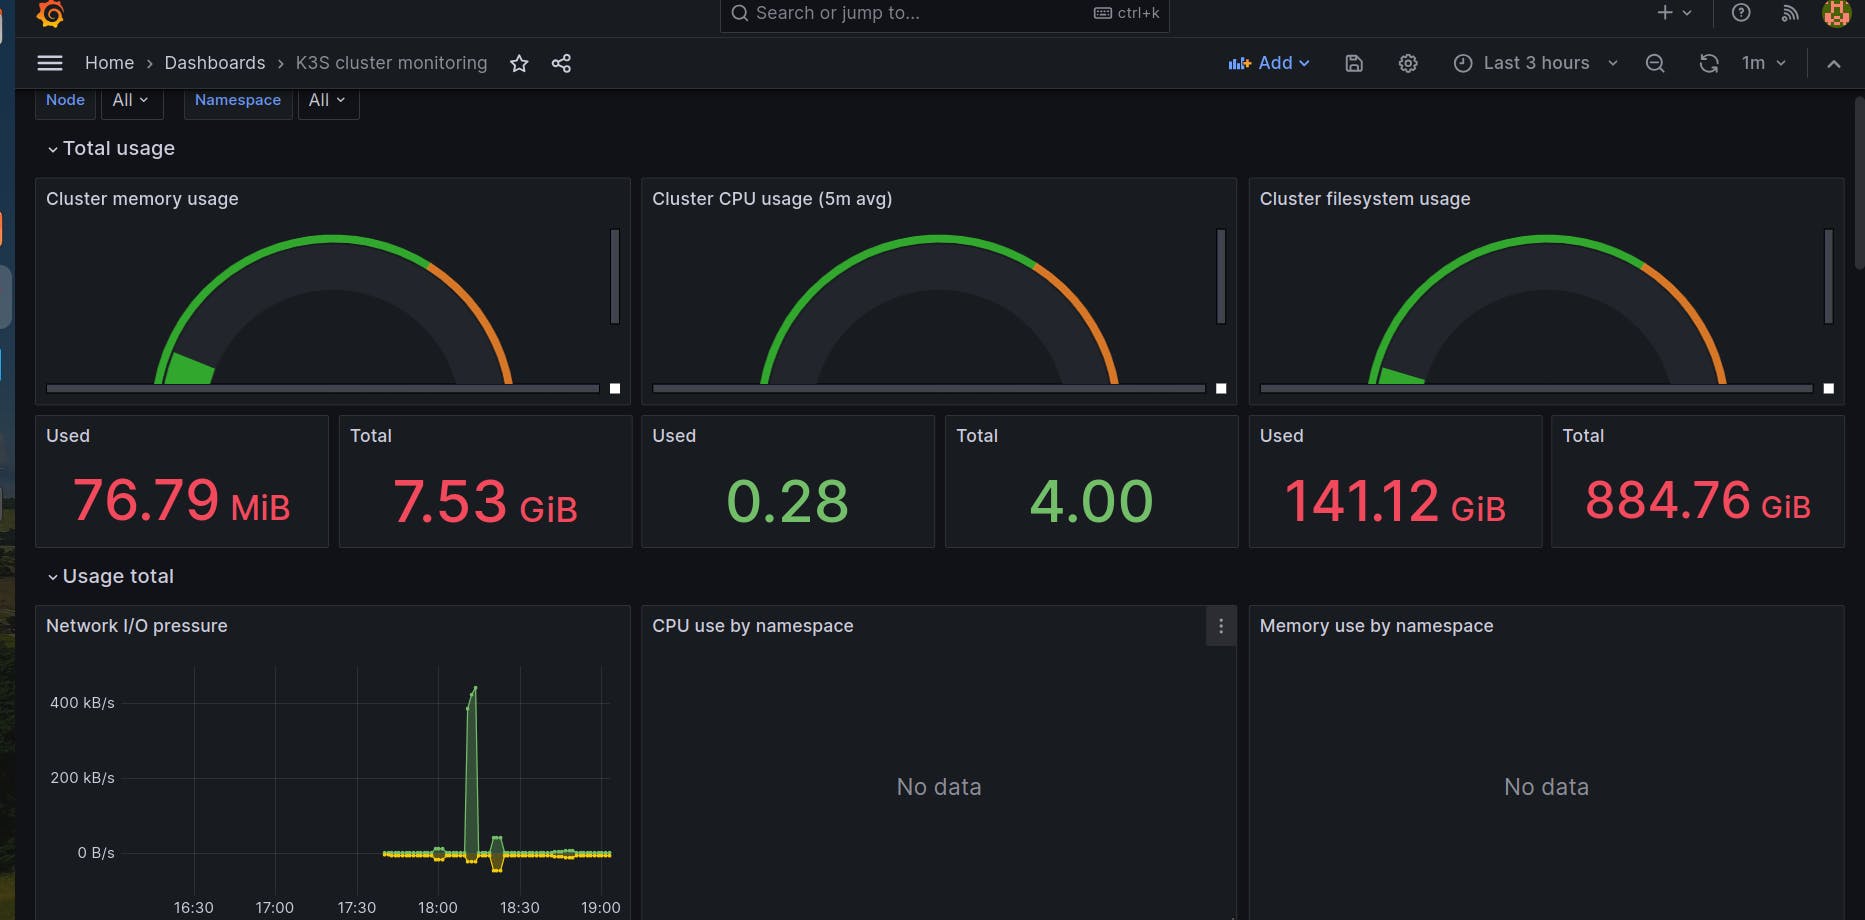
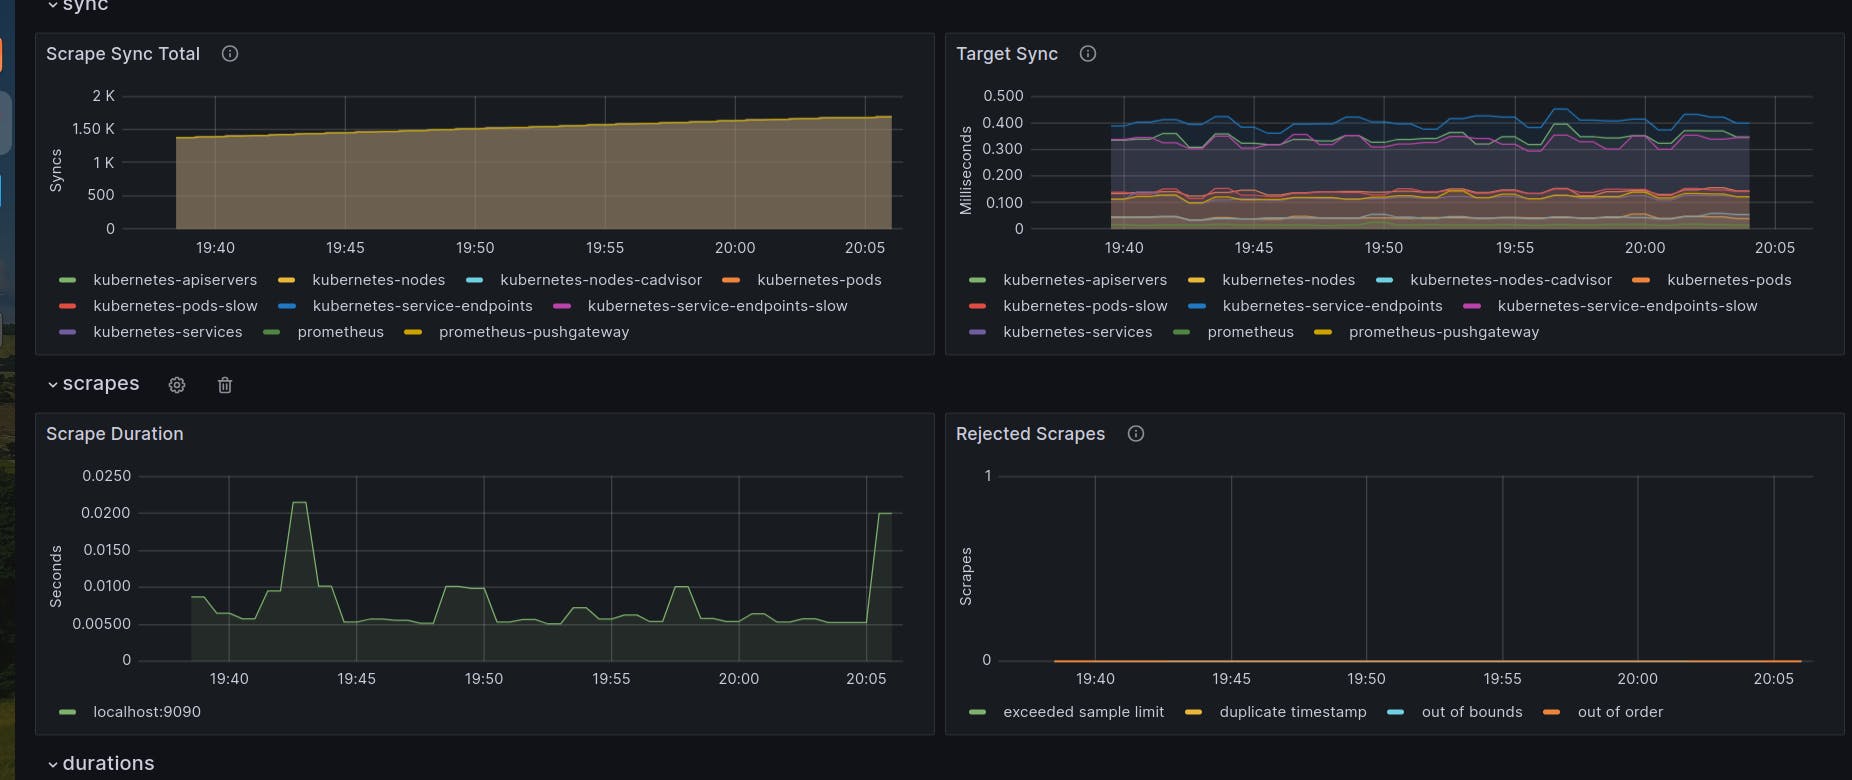
Using the dashboard:3662
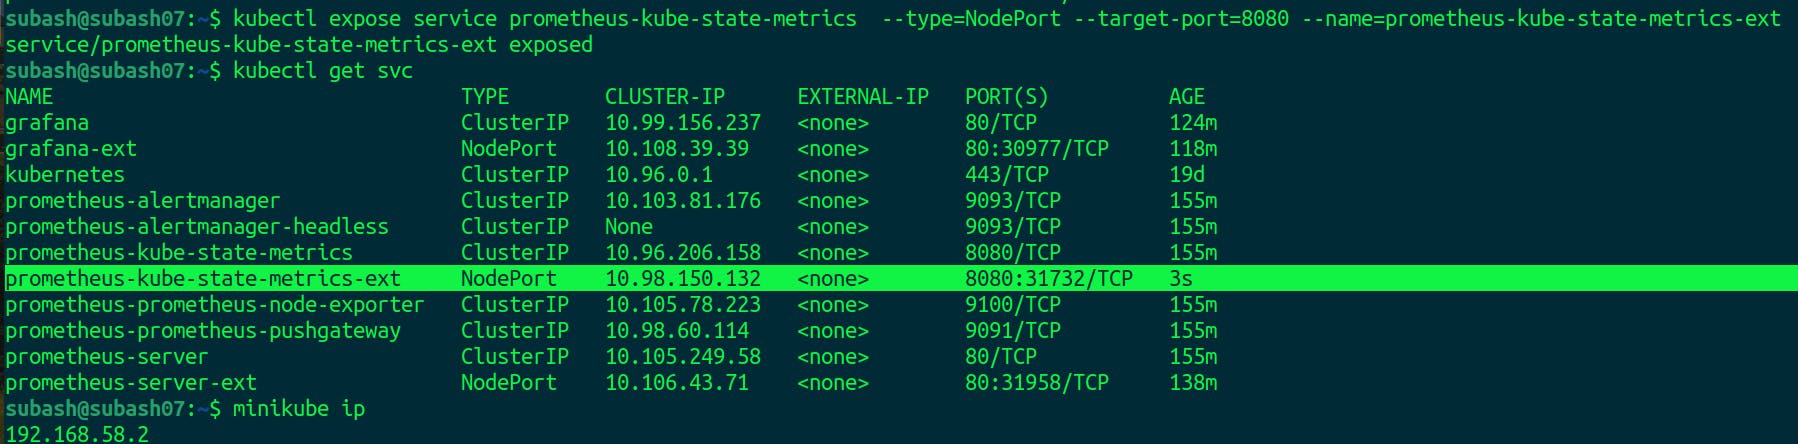
We can also expose the kube-state metrices.
To expose Kube-state metrics
kubectl expose service prometheus-kube-state-metrics --type=NodePort --target-port=8080 --name=prometheus-kube-state-metrics-ext
We can also set this kube-state-metrics endpoint as a job in Kubernetes to know about the kube-state details.
Hence, the detailed steps covered the installation of both monitoring tools (Prometheus and Grafana) using Helm charts. The exposure of services via NodePort for simplicity, and the integration of pre-built dashboards in Grafana to visualize Kubernetes metrics.
It is important to note, however, that while using NodePort for external access is suitable for local or testing environments, it may not be the best practice for production setups. In production, a more secure and scalable approach involves utilizing an Ingress controller or LoadBalancer service type for external access to Prometheus and Grafana. These options provide better control over routing and security, ensuring a more robust and production-ready monitoring solution for Kubernetes clusters.
Happy Learning!!